Figures & data
Figure 1. Relative Rh activity values for various liposomal compositions in HEPES buffer (pH = 7.4). (Error bars represent standard deviations). (1) 47.5% POPC + 47.5% CHOL + 5.0% PEG-PE-2000; (2) 57.0% POPC + 38% CHOL + 5.0% PEG-PE-2000; (3) 66.5% POPC+ 28.5% CHOL + 5.0% PEG-PE-2000; (4) 57.0% DPPC + 38% CHOL + 5.0% PEG-PE-2000; (5) 66.5% DPPC + 28.5% CHOL + 5.0% PEG-PE-2000; (6) 85.5% DPPC + 9.5% CHOL + 5.0% PEG-PE-2000; (7) 66.5% LEC + 28.5% CHOL + 5.0% PEG-PE-2000; (8) 85.5% LEC + 9.5% CHOL + 5.0% PEG-PE-2000.
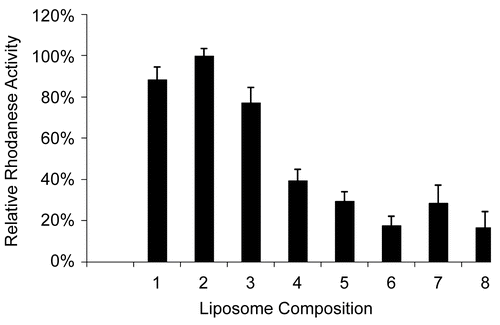
Figure 2. Formation of SCN as a function of increasing amounts of SL-Rh. The rate of SCN formation was directly proportional to the amount of encapsulated enzyme in the system. Blank contained the same concentration of cyanide and thiosulfate without Rh or SL. Each data point is the average of triplicate assays; in all cases the experimental error was less than 10%. SL alone did not generate product formation.
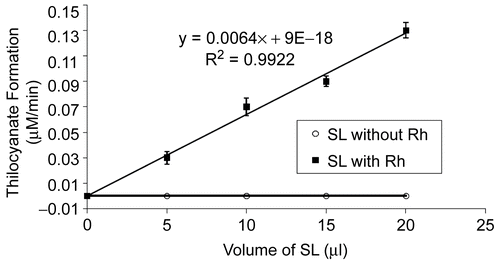
Table 1. Viscosity of empty (control) and Rh-containing SUVs at two different temperatures in HEPES with the optimal lipid composition. Rh and lipid concentration were 0.5 mg/ml and 10.0 mg/ml, respectively.
Figure 3. EPR spectra of liposomes in various hydrating buffers using SL-SPPC-5 spin label (pH = 7.4). Rh in a concentration of 0.5 mg/ml has only a slight rigidizing effect in case of the optimal liposomal composition (in both hydrating buffers).
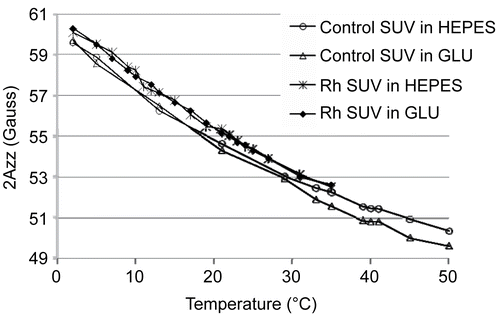
Table 2. Average size (zave) and polydispersity index (PDI) of DOPC comprised liposomes passed through filters with various pore sizes and containing varying Rh concentrations in HEPES at pH = 7.4.
Table 3. Average size (zave) and polydispersity index (PDI) of POPC comprised liposomes passed through filters with various pore sizes and containing varying Rh concentrations in HEPES at pH = 7.4.
Table 4. The zeta-potential of sterically stabilized control (empty) liposomes in two different hydrating solutions (HEPES or GLU) at various pH values.
Table 5. The effect of Rh on the zeta-potential of sterically stabilized liposomes at two various Rh concentrations (0.1 and 0.3 mg/ml) at pH = 7.4 in HEPES.
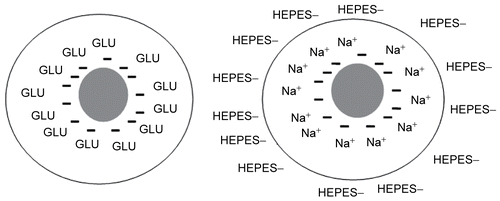
Figure 4. The role of hydrating solution in the zeta-potential of liposomes. Liposomes in HEPES possess slightly positive charge, while in GLU they have pronounced negative charge.