1,013
Views
26
CrossRef citations to date
0
Altmetric
Research Article

Folate receptor mediated intracellular gene delivery using the charge changing solid lipid nanoparticles

, , , , , , , & show all
Pages 341-347 | Received 17 Nov 2008, Accepted 18 May 2009, Published online: 17 Jul 2009

Figures & data

Figure 1. The chemical structure of Chitosan-Foloc Acid conjugation and CHETA.

Figure 1.  The chemical structure of Chitosan-Foloc Acid conjugation and CHETA.

Table 1. Zeta potential and size distribution of three different nanoparticles.

Figure 2. Scanning electron micrograph of Folate-chitosan-CHETA-Sln, scale bar: 1.0mm.

Figure 2.  Scanning electron micrograph of Folate-chitosan-CHETA-Sln, scale bar: 1.0mm.

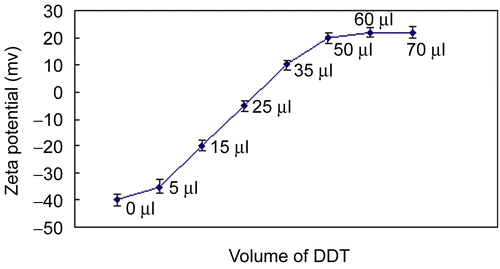
Figure 3. Zeta potential of folate-chitosan-CHETA−Sln after reaction with different mount of DDT.

Figure 3.  Zeta potential of folate-chitosan-CHETA−Sln after reaction with different mount of DDT.

Figure 4. Viability of HEK293 cells determined in the MTT assay under different experimental conditions (15 mg/well): (A) Folate-chitosan-CHETA−Sln; (B) Folate-chitosan-Sln; (C) Cheta−Sln; (D) Lipofectamine 200; (E) Naked DNA. Results are presented as mean ± standard deviation (S.D.) (n = 5).

Figure 4.  Viability of HEK293 cells determined in the MTT assay under different experimental conditions (15 mg/well): (A) Folate-chitosan-CHETA−Sln; (B) Folate-chitosan-Sln; (C) Cheta−Sln; (D) Lipofectamine™ 200; (E) Naked DNA. Results are presented as mean ± standard deviation (S.D.) (n = 5).
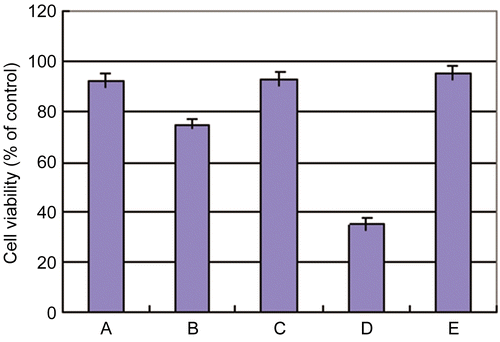
Figure 5. The flourescence images of eGFP gene expression in SKOV3 cells (folate receptor over-expressing, R+) and A549 cells (folate receptor deficient, R-) transfected by three different kinds of nanoparticles at the absence of serum. It was observed under the inverse fluorescence microscope (Olympas, japan).
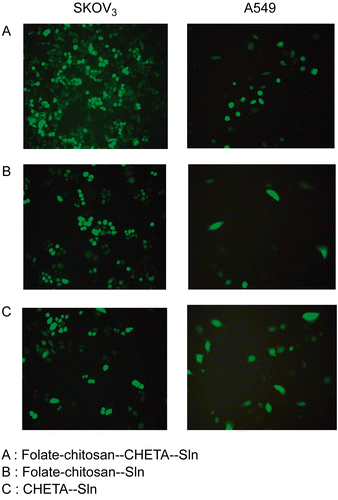
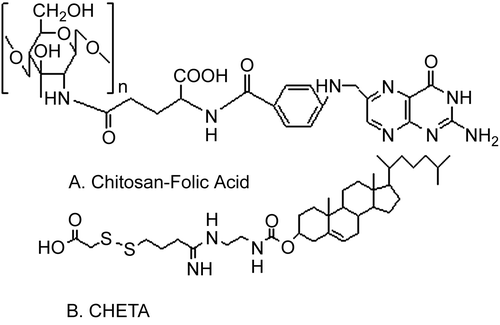
Figure 5.  The flourescence images of eGFP gene expression in SKOV3 cells (folate receptor over-expressing, R+) and A549 cells (folate receptor deficient, R-) transfected by three different kinds of nanoparticles at the absence of serum. It was observed under the inverse fluorescence microscope (Olympas, japan).
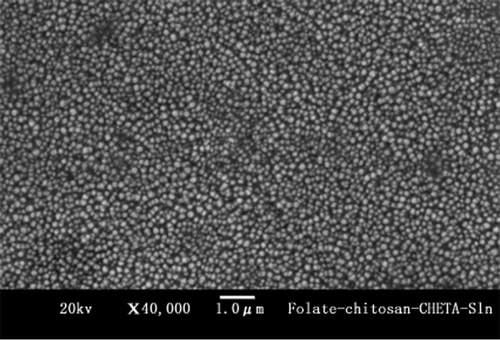
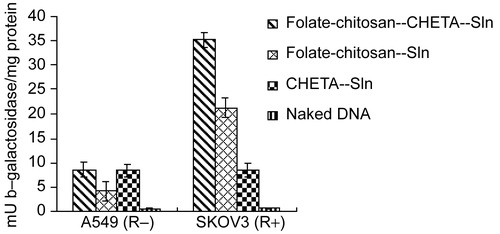
Figure 6. Transfectivities of Folate-chitosan-CHETA-Sln, Folate-chitosan−Sln, CHETA−Sln and naked DNA in SKOV3 cells (R+) and A549 cells (R-) at the absence of serum. The data represent the mean ± S.D of three wells and was representative of three independent experiments.

Figure 6.  Transfectivities of Folate-chitosan-CHETA-Sln, Folate-chitosan−Sln, CHETA−Sln and naked DNA in SKOV3 cells (R+) and A549 cells (R-) at the absence of serum. The data represent the mean ± S.D of three wells and was representative of three independent experiments.

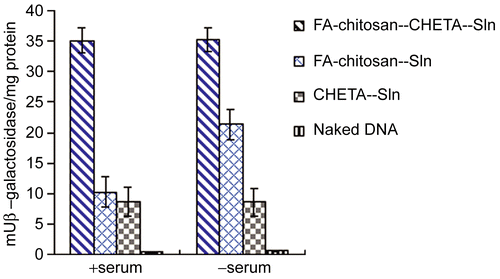
Figure 7. Transfectivities of Folate-chotosan-CHETA−Sln, Folate-chotosan−Sln, CHETA−Sln and naked DNA in SKOV3 cells (R+) at the presence or absence of serum (10%, v/v). The data represent the mean ± SD. of three wells and was representative of three independent experiments.

Figure 7.  Transfectivities of Folate-chotosan-CHETA−Sln, Folate-chotosan−Sln, CHETA−Sln and naked DNA in SKOV3 cells (R+) at the presence or absence of serum (10%, v/v). The data represent the mean ± SD. of three wells and was representative of three independent experiments.

Reprints and Corporate Permissions

Please note: Selecting permissions does not provide access to the full text of the article, please see our help page How do I view content?

To request a reprint or corporate permissions for this article, please click on the relevant link below:

Academic Permissions

Please note: Selecting permissions does not provide access to the full text of the article, please see our help page How do I view content?

Obtain permissions instantly via Rightslink by clicking on the button below:

If you are unable to obtain permissions via Rightslink, please complete and submit this Permissions form. For more information, please visit our Permissions help page.