Figures & data
Figure 1. Characterization images of drug-loaded nanoparticles. A(a), A(b) and A(c) are TEM images of QT-loaded PLGA-TPGS nanoparticles (QPTN), QT-loaded PLGA nanoparticles (QPN) and QT/coumarin-6-loaded PLGA-TPGS nanoparticles (QCPTN), respectively (200 000×); B(a), B(b) and B(c) are SEM images of QPTN, QPN and QCPTN, respectively (30 000×).
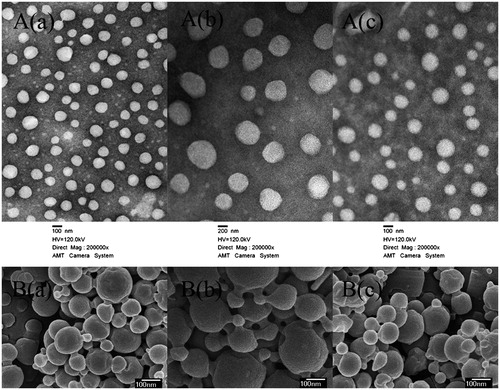
Table 1. Characterization of NPs (n = 6, mean ± SD).
Figure 2. A(a), A(b) and A(c) are the size distribution by intensity images of QPTN, QPN and QCPTN, respectively; B is the in vitro drug release profiles of QT, QPTN, QCPTN and QPN, respectively. All release data represent the mean ± SD of sextuplicate experiments. *p < 0.05 versus corresponding QPTN and QCPTN.
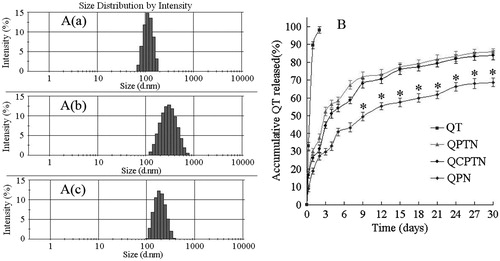
Figure 3. Confocal laser scanning microscopy (CLSM) images of HepG2 and HCa-F cells after incubation with 200 μg/mL QCPTN for 2 h at 37 °C. QCPTN was green while nuclei of the cells were blue stained using DAPI. A(a) and B(a) are green fluorescence of QCPTN uptaken by HepG2 cells and HCa-F cells, respectively; A(b) and B(b) are blue fluorescence of HepG2 cells and HCa-F cells nuclei dyed by DAPI; A(c) and B(c) are bright field images of HepG2 cells and HCa-F cells, respectively; A (d) is a combined image of A(a) and A(b), and B(d) is a combined image of B(a) and B(b), respectively.
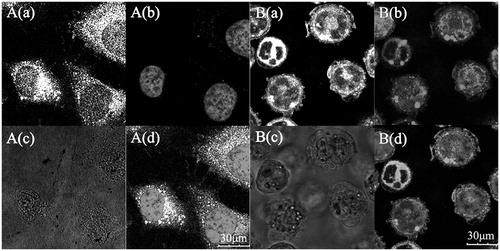
Table 2. Effect on apoptosis of HepG2 cells induced by QPTN, QTS and FS after 24 h (n = 6, mean ± SD).
Figure 4. QT concentration-time column shape images of plasma and different organs. (A) QCPTN group, *p < 0.05, #p < 0.01 versus corresponding liver; (B) QTS group, *p < 0.05, #p < 0.01 versus corresponding plasma. All data represent the mean ± SD of experiments in decuplicate.
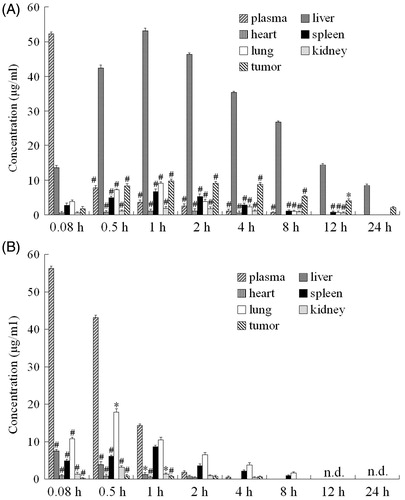
Table 3. TIliver and SI values of QCPTN in mice at different timepoints after tail-intravenous administration.
Table 4. AUC, Re and Te values of QT in the plasma and different tissues of mice after tail-intravenous administration (n = 10, mean ± SD).
Figure 5. Fluorescence microscopy images (200×) of the liver frozen slices for the blank group and experiment groups of the mice injected with QCPTN at 0.5, 1, 2, 4, 8 and 12 hours. A images are liver frozen slices of blank group, B-G images are liver frozen slices of the experiment groups which were picked at 0.5, 1, 2, 4, 8 and 12 hours, respectively. The left images are green fluorescence of QCPTN with C6 (pointed to by the arrows); the right images are observed from white light channel.
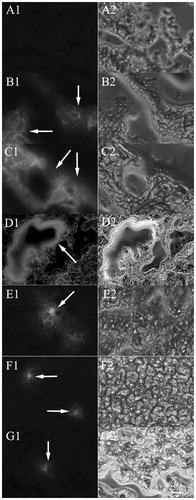
Figure 6. Fluorescence microscopy images (200×) of the tumor frozen slices for the blank group and experiment groups of the mice injected with QCPTN at 0.5, 1, 2, 4, 8 and 12 hours. A images are tumor frozen slices of blank group, B-G images are tumor frozen slices of the experiment groups which were picked at 0.5, 1, 2, 4, 8 and 12 hours, respectively. The left images are green fluorescence of QCPTN with C6 (pointed to by the arrows); the right images are observed from white light channel.
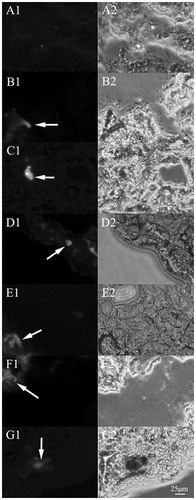
Table 5. Pharmacokinetic parameters on rats treated with QPTN, QPN and QTS (n = 6, mean ± SD).
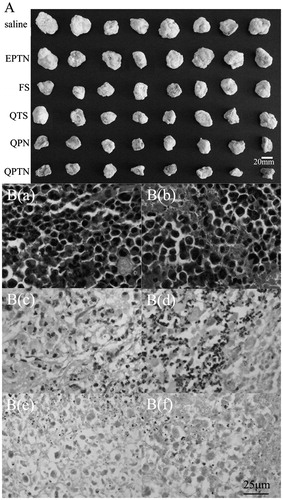
Figure 7. Images of the in vivo therapeutic effect. (A) Morphology of all tumors isolated from the sacrificed mice in each group after 10 days of administration; (B) The six images are representative H&E staining of tumors. B(a), B(b), B(c), B(d), B(e) and B(f) is the image of treated with normal saline control, empty PLGA-TPGS nanoparticles (EPTN), QT solutions (QTS), 5-Fluorouracil solutions (FS), QT-loaded PLGA nanoparticles (QPN) and QT-loaded PLGA-TPGS nanoparticles (QPTN), respectively. The tissue slices were H&E stained and observed by microscope (400×).