Figures & data
Table 1. Design parameters and constraints for full factorial design (23).
Table 2. Experimental runs independent variables (formulation variables) of the 23 full factorial experimental design.
Figure 1. Line charts showing the effects of (a) type of SAA (X1) and the FAA (X2) on the E.E (%) of ZT-loaded novasomes, (b) type of SAA (X1) and the FAA (X3) on the E.E (%) of ZT-loaded novasomes, (c) type of SAA (X1) on the particle size of ZT-loaded novasomes, (d) type of SAA (X1) and the ratio of FAA: SAA (X3) on the particle size of ZT-loaded novasomes, (e) type of SAA (X1) and the type of FAA(X2) on the PDI of ZT-loaded novasomes.
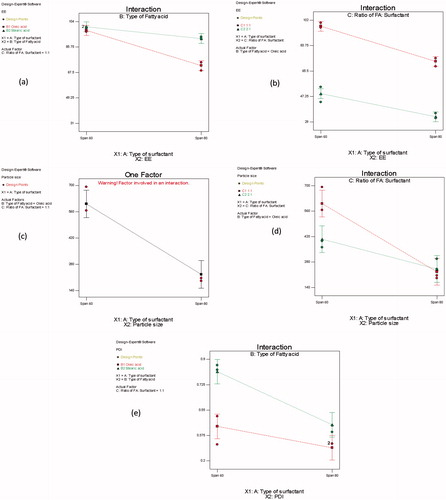
Figure 2. Line charts showing the effects of (a) type of SAA (X1) and the FAA (X2) on the ZP of ZT-loaded novasomes, (b) type of SAA (X3) on the ZP of ZT-loaded novasomes.
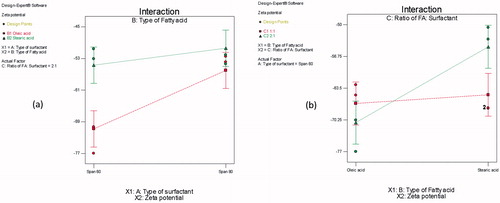
Figure 3. Release profiles of ZT from different ZT-loaded novasomes and ZT solution.
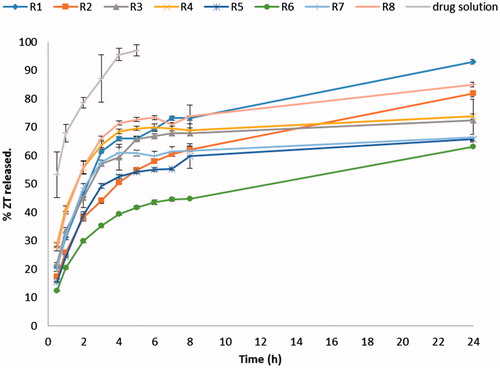
Figure 4. Line charts showing the effects of (a) type of SAA (X1) and the FAA (X2) on the ZT (%) released after 2h from ZT-loaded novasomes, (b) type of FAA (X2) and the ratio of FAA: SAA (X3) on the ZT (%) released after 2h from ZT-loaded novasomes.
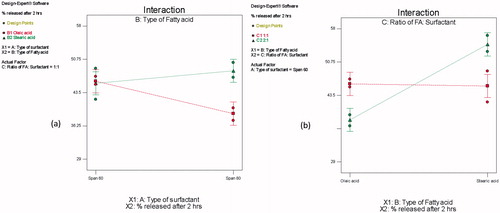
Figure 5. TEM image of optimized R7 dispersion.
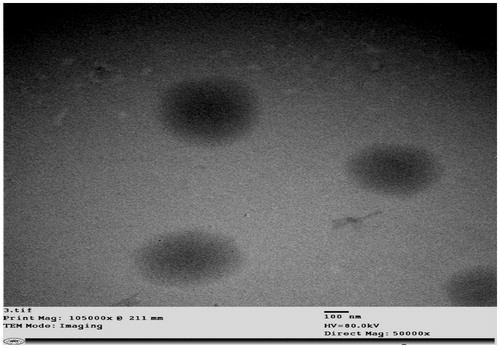
Figure 6. DSC thermographs of (a) stearic acid, (b) ZT, (c) cholestrol, (d) Span® 80 and (e) lyophilized (R7).
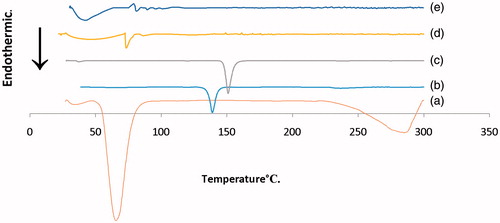
Figure 7. XRD spectra of the samples.
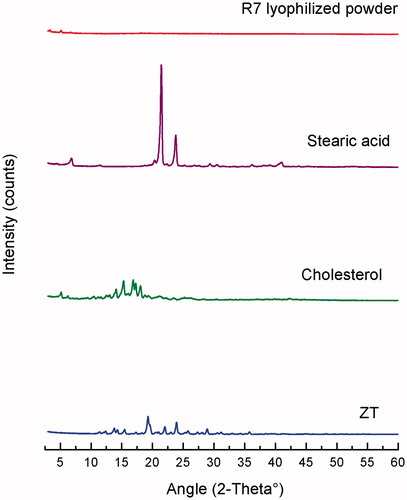
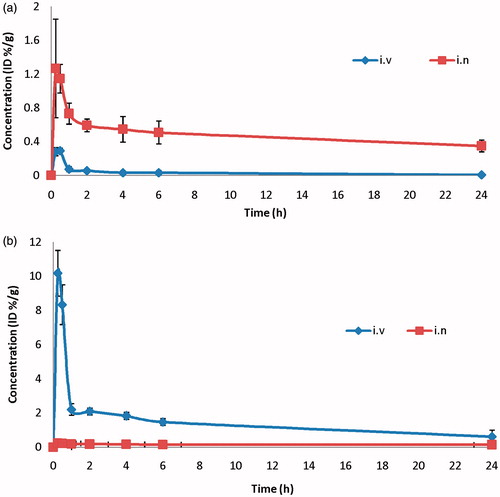
Figure 8. ZT concentration in (a) brain, (b) blood of Wister albino male mice at different time of intervals following of IV 99mTc-ZT solution in IN 99mTc-R7 novasomes, mean ± SD n = 3.