Figures & data
Figure 1. Time-dependent heating curve of the suspension of magnetic fluid Fe3O4 and TSMLs upon the application of AC magnetic field of 10 kA/m operating at 423rkHz.
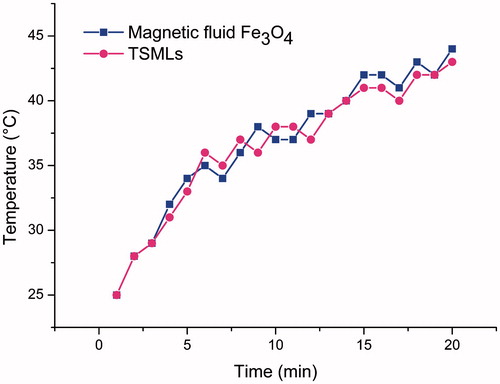
Figure 2. Design and characterization of the constructed DOX-CPPs/TSMLs. Transmission electron micrographs (A). Transmission and backscattering profiles of liposomes using Turbiscan Lab® Expert (B).
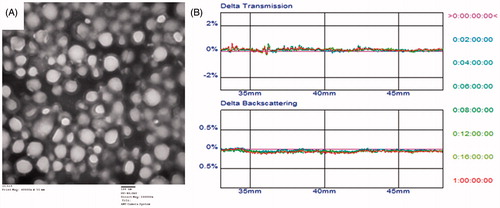
Table 1. Characteristics of the TSMLs.
Figure 3. Release behaviors of DOX-CPPs from TSMLs under AC magnetic field. The data are presented as the mean ± SD (n = 3).
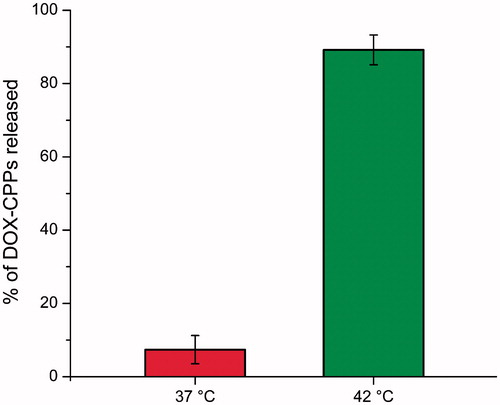
Figure 4. Cytotoxicity of DOX, DOX-CPPs (A), and activated DOX-CPPs-TSMLs, unactivated DOX-CPPs-TSMLs (B) against MCF-7 cells with different concentrations. The data are presented as the mean ± SD (n = 6). * indicates p < 0.05.
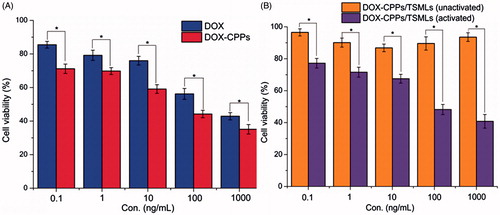
Figure 5. Biodistribution of DIR contained in various formulations in mice bearing MCF-7 tumor xenografts. Whole-body imaging of 12ag after systemic administration (A). Fluorescence detection of isolated main tissues and organs from mice at the end point of observation (B).
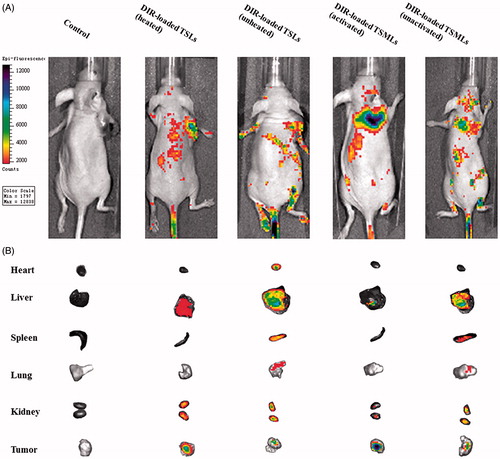
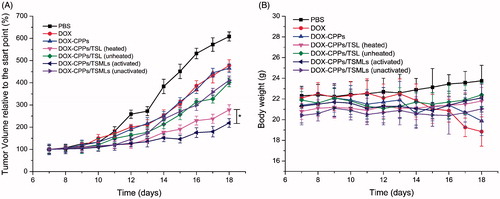
Figure 6. Antitumor activity (A) and body weight changes (B) in MCF-7 tumor-bearing mice after treatments with PBS and various formulations. The data are presented as the mean ± SD (n = 6). *indicates p < 0.05.