Figures & data
Table 1. Variables in 33 central composite face-centered design (CCFD) for CZTable Footnotea polymeric micelles.
Table 2. Factors’ levels for the 33 central composite face-centered design (CCFD) used to prepare CZ polymeric micelles.
Table 3. The measured responses of the central composite face-centered design (CCFD) of CZ polymeric micelles (mean ± SD, n = 3).
Figure 1. In vitro CZ release profiles from investigated polymeric micelle and the drug solution in ethanol:water (1:1) at 37 ± 0.5 °C, mean ± SD, n = 3.
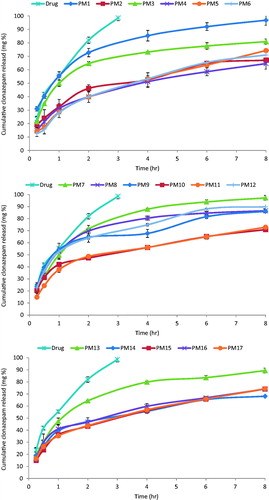
Table 4. Fitting CZ release to zero, first, and Higuchi diffusion models.
Figure 2. DSC thermograms of CZ, Pluronic® P123, Pluronic® L121, and the optimized polymeric micelle (PM7).
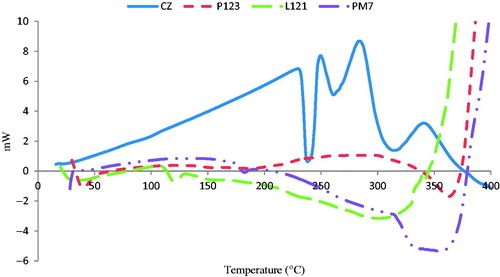
Figure 3. TEM photomicrographs of mixed Pluronic® L121/P123 polymeric micelles (PM7).
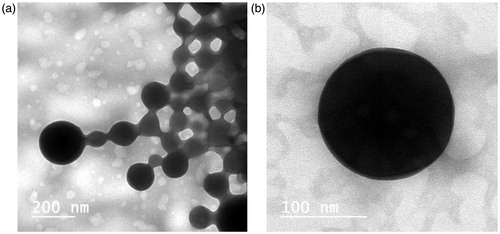
Figure 4. Photomicrographs of the anterior segments of sheep nasal mucosa treated with pH 6.4 PBS (negative control, a), isopropyl alcohol (positive control, b), and CZ-loaded polymeric micelles (c) (100×).
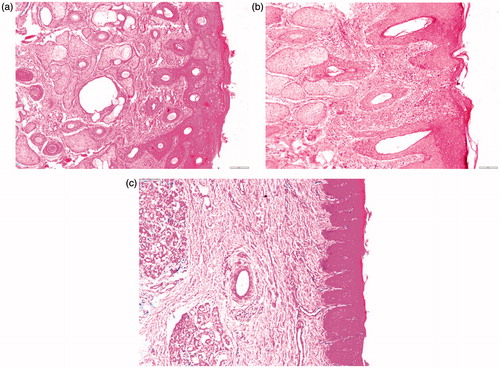
Figure 5. Photomicrographs of the posterior segments of sheep nasal mucosa treated with pH 6.4 PBS (negative control, a), isopropyl alcohol (positive control, b), and CZ-loaded polymeric micelles (c) (100×).
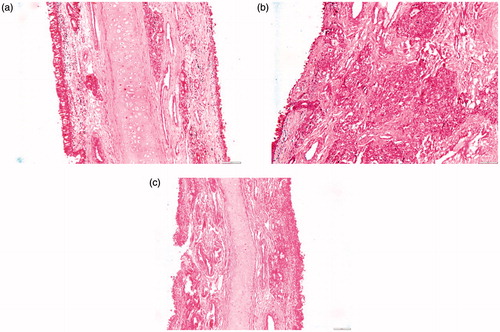
Figure 6. Variation of the radiochemical yield of 99mTc-clonazepam as a function of clonazepam amount (a), Na2S2O4 amount (b), pH (c), reaction temperature, (d) and time (e).
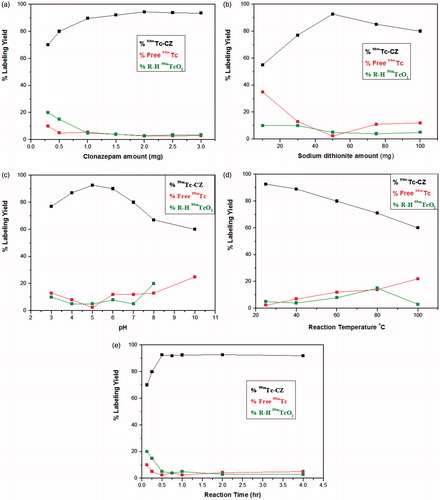
Figure 7. CZ concentration in brain at different time intervals following administration of intranasal 99mTc-CZ solution, intranasal 99mTc-PM7 and intravenous 99mTc-PM7, mean ± SD, n = 3, in male Swiss albino mice.
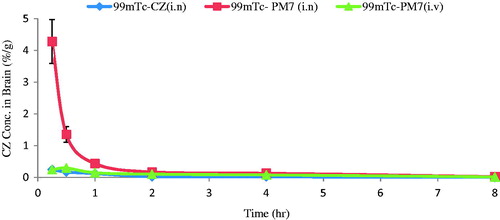
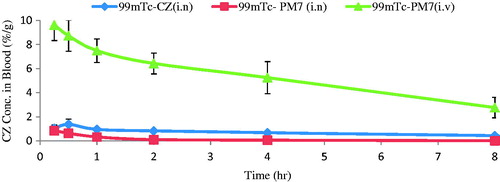
Figure 8. CZ concentration in blood at different time intervals following administration of intranasal 99mTc-CZ solution, intranasal 99mTc-PM7 and intravenous 99mTc-PM7, mean ± SD, n = 3, in male Swiss albino mice.