Figures & data
Figure 1. A sketch of the preparation of BN-PEG-NLC. BN: baicalin; PEG: polyethylene glycol; NLC: nanostructured lipid carriers.
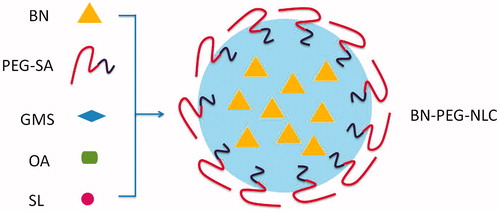
Table 1. Characterization of NLC.
Figure 2. In vitro release profiles of BN from BN-PEG-NLC, BN-NLC, or BN solution. BN: baicalin; PEG: polyethylene glycol; NLC: nanostructured lipid carriers.
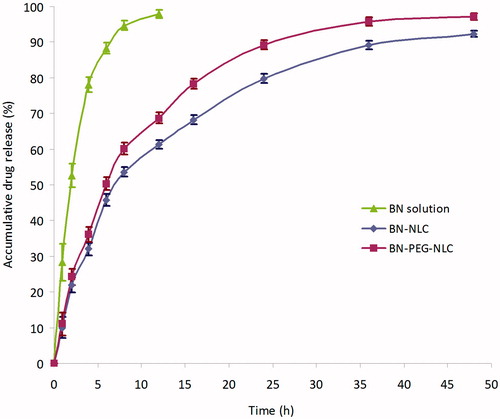
Figure 3. The plasma concentration-time profiles of BN following single dose i.v. administration of BN solution, BN-NLC, and BN-PEG-NLC. BN: baicalin; PEG: polyethylene glycol; NLC: nanostructured lipid carriers.
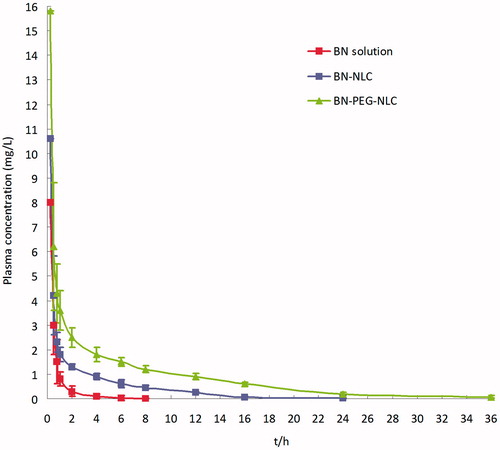
Table 2. Pharmacokinetic parameters of BN after i.v. injecting of BN solution, BN-NLC, and BN-PEG-NLC in rats at a dose of 10 mg/kg (n = 6).
Figure 4. BN tissue concentration of heart, liver, spleen, lung, kidney, and brain at 15 min following i.v. administration of BN solution, BN-NLC, and BN-PEG-NLC in acute MI rat models. BN: baicalin; PEG: polyethylene glycol; NLC: nanostructured lipid carriers.
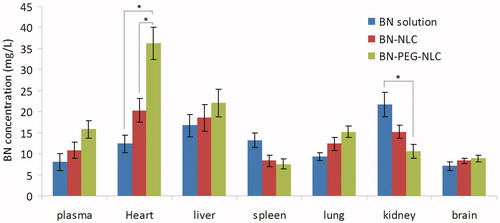
Figure 5. The images of BN solution, BN-NLC, and BN-PEG-NLC on infract size. BN: baicalin; PEG: polyethylene glycol; NLC: nanostructured lipid carriers.
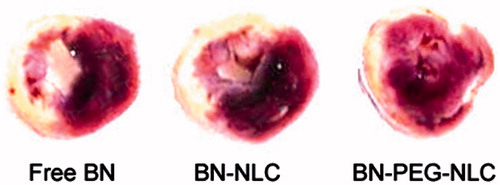
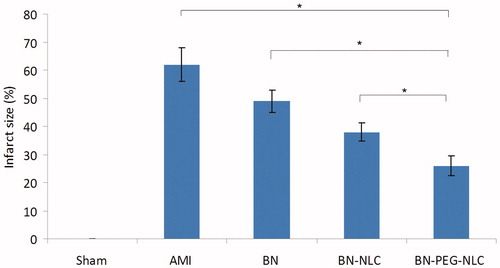
Figure 6. The effect of BN solution, BN-NLC, and BN-PEG-NLC on infract size. BN: baicalin; PEG: polyethylene glycol; NLC: nanostructured lipid carriers.