Figures & data
Table 1. Ranges of the factors investigated using 32 factorial experimental design.
Figure 1. Comparative solubility profiles of LE in various (A) oils, (B) surfactants and (C) cosurfactants.
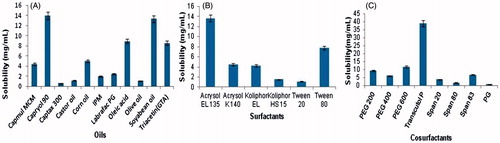
Figure 2. Pseudoternary phase diagrams composed of Capryol 80: Tween 80: Transcutol P dispersed with water at 37 °C. Smix ratio = 1:1 (A), 2:1 (B), 3:1 (C) and 4:1 (D).
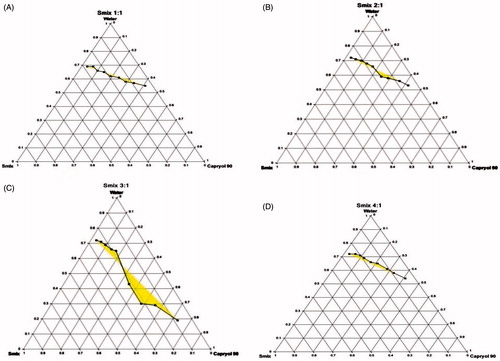
Table 2. Results of physicochemical properties of prepared LE-loaded nanoemulsions and statistical analysis of measured responses.
Figure 3. Response surface plot (A) for mean globule size and (B) PDI and (C) Contour plot for overall desirability (D).
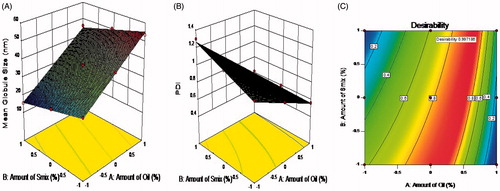
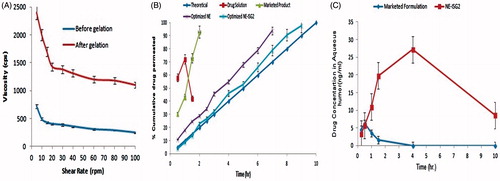
Figure 4. (A) Rheological profile of NE-ISG5 before and after gelation, (B) comparison of ex-vivo transcorneal permeation, (C) comparison of Aqueous humor concentration–time profiles of NE-ISG2 and the marketed formulation in rabbits (mean ± SD, n = 5).