Figures & data
Figure 1. Scheme of the synergistic mechanisms of nanosized CE + DTX-LNS. After intravenous administration, CE + DTX-LNS was accumulated at tumor site through EPR effect and internalized into same cell through vesicles and caveolae mediated endocytosis. Subsequently, CE and DTX with different anti-cancer mechanisms were released independently from CE + DTX-LNS inside the same cancer cell and killed the cancer cell in an enhanced synergistic manner.
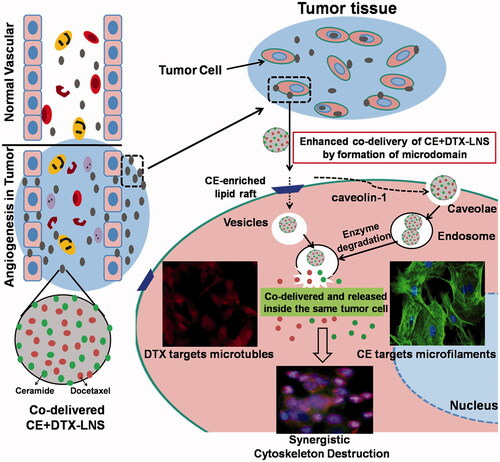
Figure 2. Characteristics of CE + DTX-LNS in vitro. (A) Particle size (a), zeta potential (b), TEM images (c) and photographs (d) of freshly prepared CE+DTX-LNS; Photographs (e) and particle size (f) of lyophilized CE + DTX-LNS. (B) In vitro drug release of CE+DTX-LNS (n = 3). (a) The release profile of DTX from CE + DTX-LNS, DTX-LNS and Duopafei® (b) The release profile of NBD-CE from NBD-CE + DTX-LNS, NBD-CE-LNS and NBD-CE-Solution. *p < 0.05, **p < 0.01, statistically significant difference between NBD-CE+DTX-LNS and NBD-CE-Solution; # p < 0.05, ##p < 0.01, statistically significant difference between CE+DTX-LNS and Duopafei®. (C) Stability of CE + DTX-LNS was evaluated by determination of particle size alteration overtime in different media: PBS, complete cell culture media and PBS containing 10% plasma (n = 3).
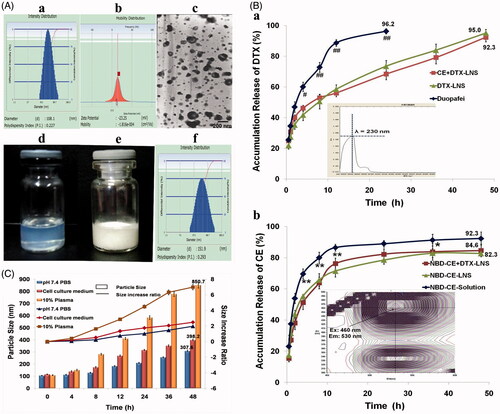
Figure 3. Co-delivery of CE and DTX via CE + DTX-LNS in vitro. (A) Co-delivery of CE and DTX via CE + DTX-LNS by fluorescence microscope (n = 3). B16 cells were incubated with NBD-CE and Rho-DTX labeled CE + DTX-LNS for 4 h while cells treated with NBD-CE-LNS + Rho-DTX-LNS were served as control (× 20). (B) Co-delivery of CE and DTX via CE + DTX-LNS by FACS analysis (n = 3). B16 and MCF-7 cells were incubated with NBD-CE and Rho-DTX labeled CE + DTX-LNS for 0.5, 2 and 4 h, respectively. Cells incubated with NBD-CE-LNS + Rho-DTX-LNS were served as control.
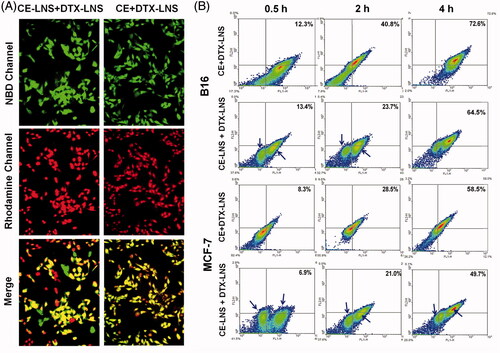
Figure 4. The anti-proliferation effect and apoptosis of CE + DTX-LNS in vitro.(A) Effects of different treatments on cell viabilities of B16 and MCF-7 cells, (n = 3). Cells were treated with CE-LNS (No DTX-LNS), DTX-LNS (No CE-LNS), CE-LNS + DTX-LNS (with DTX-LNS 20 μM or with CE-LNS 10 μM) at different molar ratio and CE + DTX-LNS. After 48 h incubation, cell viabilities were evaluated by MTT assay. * p < 0.05, ** p < 0.01, statistically significant difference between CE-LNS and CE + DTX-LNS; # p < 0.05, ## p < 0.01, statistically significant difference between DTX-LNS and CE + DTX-LNS. (B) Caspase-3 activity after different treatments on B16 and MCF-7 cells. ** p < 0.01, statistically significant difference between CE-LNS and CE + DTX-LNS; ## p < 0.01, statistically significant difference between DTX-LNS and CE + DTX-LNS; & p < 0.05, && p < 0.01, statistically significant difference between CE + DTX-solution and CE + DTX-LNS.
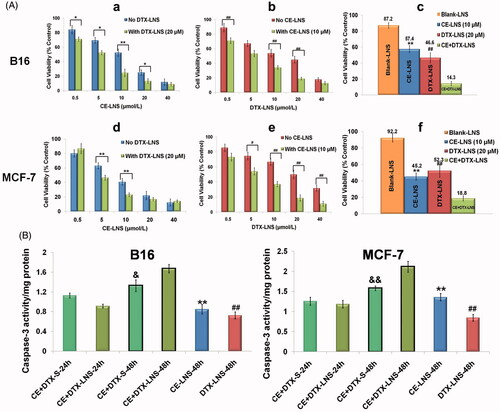
Figure 5. The biodistribution of CE + DTX-LNS by live imaging system in vivo and ex vivo. (A) Fluorescence images of B16 tumor bearing mice at different time intervals after intravenous administration of CE + DTX-LNS (n = 3). Mice administered with NBD-CE and Rho-DTX dual labeled CE + DTX-solution (NBD-CE and Rho-DTX dissolved in DMSO and diluted with PBS) and N.S were served as control. (B) Ex vivo fluorescence images of tissues and tumor after intravenous administration of CE + DTX-LNS and CE + DTX-solution. (C) Quantitative analysis for the ex vivo tissues and tumor (n = 3). # p < 0.05, ## p < 0.01.
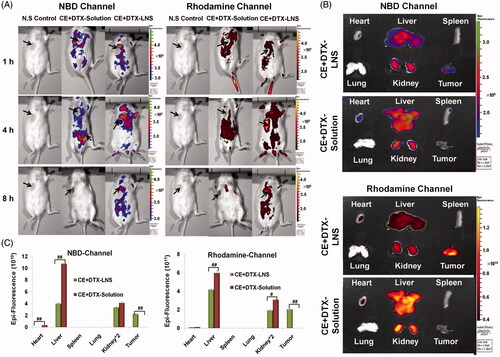
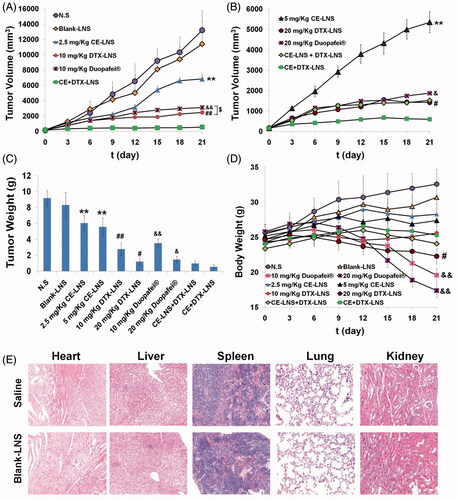
Figure 6. The antitumor effect of CE + DTX-LNS in B16 tumor bearing mice in vivo and the histological evaluation. Mice treated with CE-LNS (2.5/5 mg/kg), DTX-LNS (10/20 mg/kg), Duopafei® (10/20 mg/kg), physical mixture of CE-LNS + DTX-LNS, Blank-LNS and N.S were served as controls (n = 5). (A) and (B) Tumor volume; (C) Tumor weight; (D) Body weight change. (E) Representative microscopy images of H&E-stained histological sections treated with saline and Blank-LNS (n = 3). The magnification was 100. Note: ** p < 0.01, statistically significant difference between CE-LNS and CE + DTX-LNS; # p < 0.05, ## p < 0.01, statistically significant difference between DTX-LNS and CE + DTX-LNS; & p < 0.05, && p < 0.01, statistically significant difference between Duopafei® and CE + DTX-LNS; $ p < 0.05, statistically significant difference between DTX-LNS and Duopafei®.