Figures & data
Table 1. Physicochemical characterization of various types of microemulsion (n = 3).
Figure 1. Release profiles, size distribution, and morphology of SD-ME. In vitro release profiles of DTX from D-ME and SD-ME and Schizandrin A under (a) artificial intestinal juice and (b) gastric juice; data are presented as mean ± SD (n = 3). (c) Morphology of SD-ME in (1) PBS, (2) artificial gastric fluid, (3) artificial intestinal fluid, and (4) 50% FBS observed by TEM. Scale bar represents 50 nm. (d) Changes of size and zeta potential of SD-ME and D-ME under different pH environments for 7 days, data are presented as mean ± SD (n = 3); insert pictures are the appearance of SD-ME after storage for 12 h to 7 days.
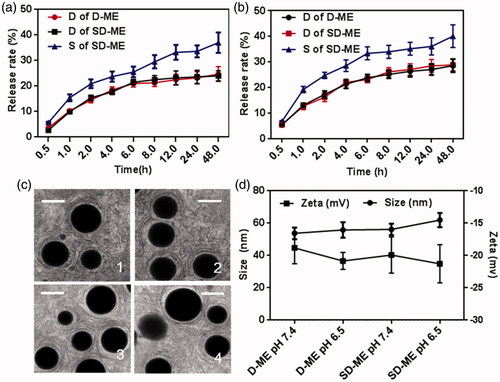
Figure 2. Cellular uptake studies. Intracellular accumulation of DTX in (a) EC109 cells and (b) EC109/DDR cells for 4 h (n = 3). **p < 0.01 versus free DTX. (c) Fluorescence images of cells treated with R123, R123-ME, and R123/S-ME. (d) Images of R123 accumulation in EC109 cells and EC109/DDR cells by flow cytometry and (e) corresponding fluorescence quantification (n = 3). **p < 0.01.
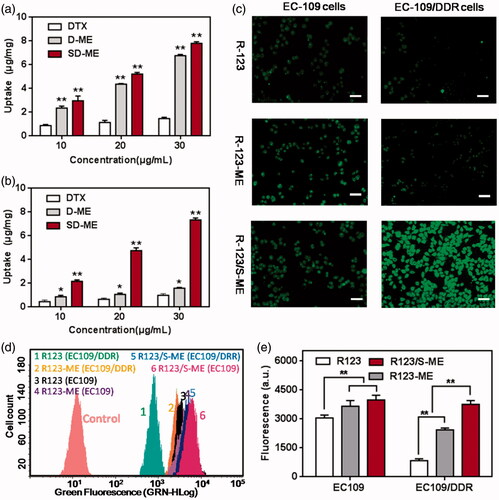
Figure 3. The cytotoxicity of various formulations against (a) EC109 cells and (b) EC109/DDR cells for 48 h (n = 6). Study on cell apoptosis induction. (c) The quadrant pictures of EC109/DDR cells treated with DTX and SD-ME at a concentration ranged from 0.1 to 10 μg/mL, and (d) the corresponding quantitative presentation. **p < 0.01 versus free DTX group.
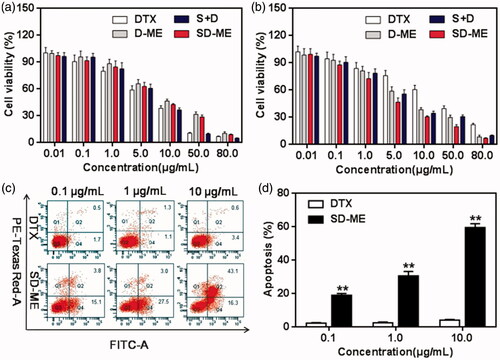
Table 2. IC50 and resistance reversion index (RRI) of different formulations against EC109 and EC109/DDR cells for 48 h (n = 6).
Figure 4. (a) P-gp expression in EC109 cells and EC109/DDR cells with or without incubation of various formulations. (n = 4, **p < 0.01 versus EC109 cells) (b) Changes of P-gp ATPase activity stimulated by potential P-gp inhibitor, microemulsion, and surfactant. (n = 4, **p < 0.01 versus untreated group; # p < 0.05 versus SD-ME.) (c) Western bolt analysis for P-gp expression treated with Schizandrin A, D-ME, and SD-ME, and (d) the corresponding quantitative analysis. (n = 3, **p < 0.01 versus control).
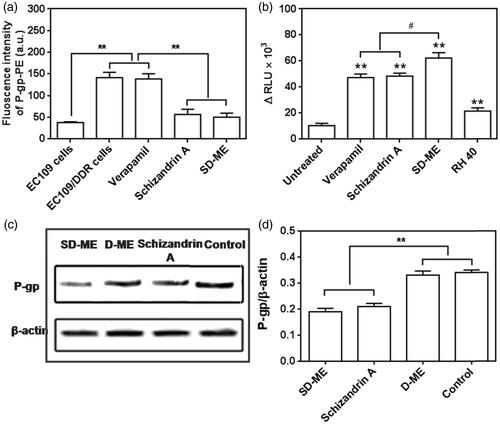
Figure 5. Evaluation on in vivo antitumor. (a) Changes in tumor volume of EC109/DDR tumor xenograft-bearing nude mice from day 10 to day 25. (n = 8, **p < 0.01 versus saline, ##p < 0.01 versus D-ME) (b) Tumor inhibition rate after antitumor treatment. (n = 8, **p < 0.01 versus DTX, ##p < 0.01 versus D-ME) (c) Survival curves within 70 days post-xenograft implantation. (d) TNF-α and IL-6 levels after intragastric administration of the different formulations for 14 days. (n = 4, *p < 0.05 and **p < 0.01 versus saline) (e) Histological section of tumor tissue collected at 72 h after the end of the treatment. The organs sections were stained with hematoxylin and eosin. Scale bar is 10 μm.
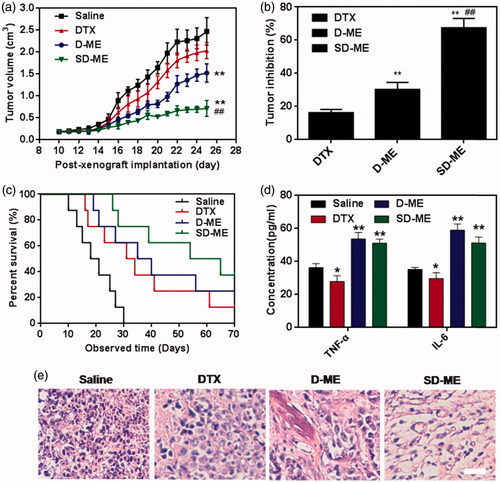
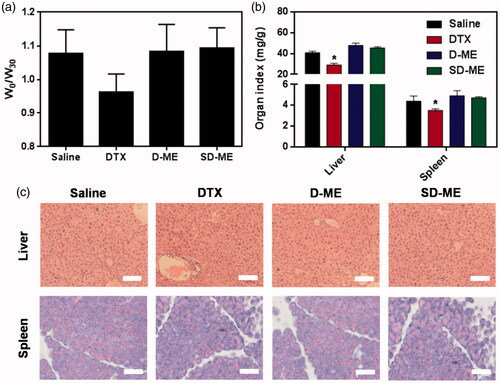
Figure 6. (a) The ratio of body weight between day 0 and day 30. (b) The weight ratio of liver/spleen to body at 72 h after the last administration. (*p < 0.05 versus saline, n = 4) (c) Histological section of liver and spleen collected at 72 h after the end of the treatment. The organs sections were stained with hematoxylin and eosin. Scale bar is 20 μm.