Figures & data
Figure 1. (a) Biodistribution profile of Dox formulations (b) Dox uptake in liver from Dox formulations, ***p < 0.001.
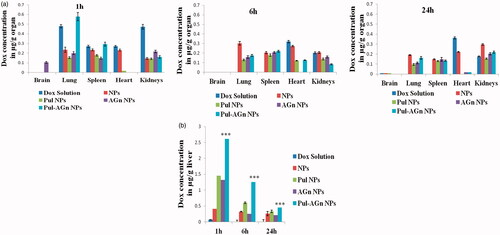
Table 1. Intrahepatic disposition of Dox formulations (mean ± SD; n = 4).
Table 2. Percent body weight gain and weight of heart and kidneys of rats (mean ± SD; n = 5).
Figure 2. The inhibition effects of Dox formulations on the in vivo tumor growth. (a) The tumor growth curves for liver tumor-bearing nude mice after intravenous injections of Dox formulations, (b) T/C values, (c) survival plot (***p < 0.001).
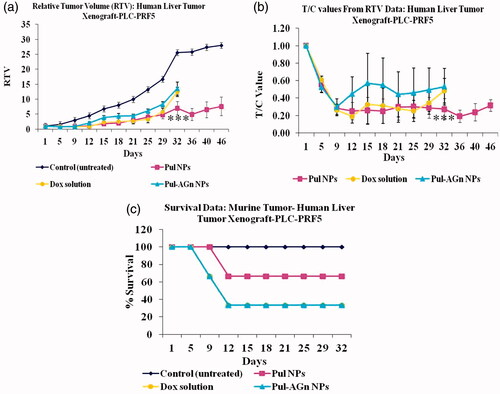
Figure 3. The picture of mice with tumor.
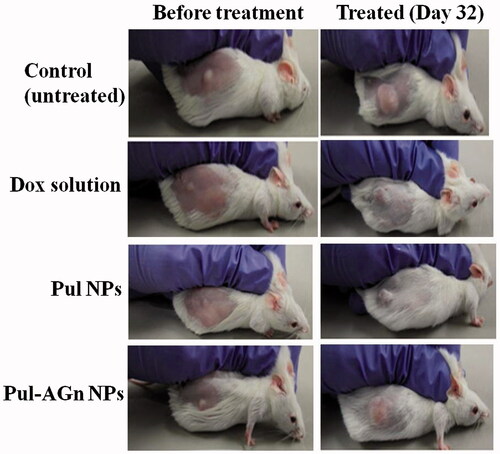
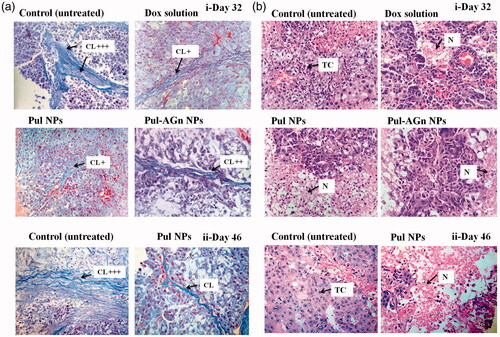
Figure 4. (a) Tumor sections were stained with Masson’s trichrome on day 32(i) and day 46 (ii) post first dose – the blue color represents collagen content. Original magnifications 400×. The collagen content was quantified using ImageJ and normalized to control (CL – collagen), (b) Images of H&E-stained tumor, sections excised from liver tumor-bearing mice following treatment with Dox formulations on day 32 (i) and day 46 (ii) post first dose. Original magnifications 400 × (TC – tumor cells with large prominent nuclei; N – necrotic cell mass).