Figures & data
Table 1. Physicochemical characterizations of baohuoside I-loaded micelles (n = 3).
Figure 1. Characteristics of the baohuoside I-loaded micelles. Size distribution of baohuoside I-loaded micelles (A). Baohuoside I release profiles from the micelles in vitro (B).Transmission electron microscope (TEM) image of baohuoside I-loaded micelles in 50 nm scale (C). Quotient of vibrational band intensities (I338/I333) from excitation spectra of pyrene as a function of lg c of mixed micelle in distilled water (D). Data are presented as the mean ± SD (n =3).
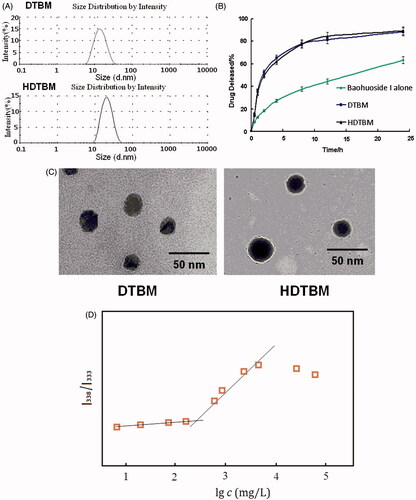
Table 2. IC50 values (μg/mL) of free baohuoside I or baohuoside I-loaded micelles against A549 cells (n = 6).
Figure 2. Cellular uptake efficiency of the baohuoside I and baohuoside I-loaded micelles by A549 cells after 1, 2 and 4 h incubation (A). Fluorescence microscope of A549 cells after 2 h incubation with the free fluorescent coumarin-6 and the coumarin-6-loaded mixed micelles (B).
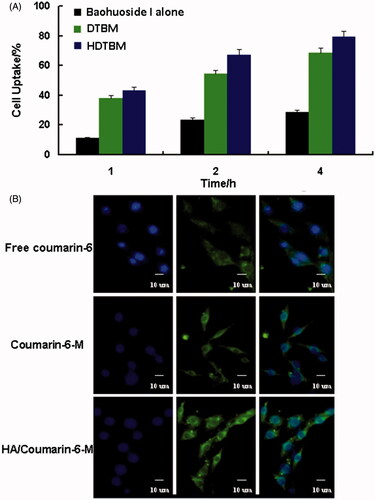
Figure 3. In vivo antitumor study of baohuoside I-loaded micelles in Balb/c nude mice implanted with A549 cells. Tumor volumes (A) and body weight (B) were monitored daily. Tumor weight (C) and organ index (D) were monitored at the end of the experiment. The results were presented as the mean ± SD (n = 6). *p <0.05, compared with control group. #p < 0.05, compared with Baohuoside I group & p < 0.05, compared with DTBM group. H&E staining of liver and kidney sections excised from A549 tumor-bearing mice following 14 d treatment with HDTBM (E). Mice treated with paclitaxel and PBS were used as controls.
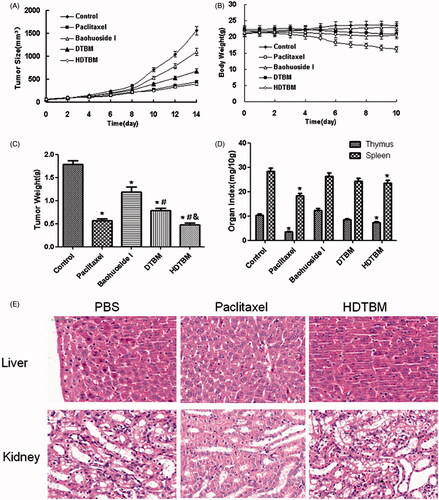
Figure 4. Fluorescence images of the mice bearing A549 cells on right sides at different time points after intravenous injection (A) and the distribution of DiR in various important organs (B).
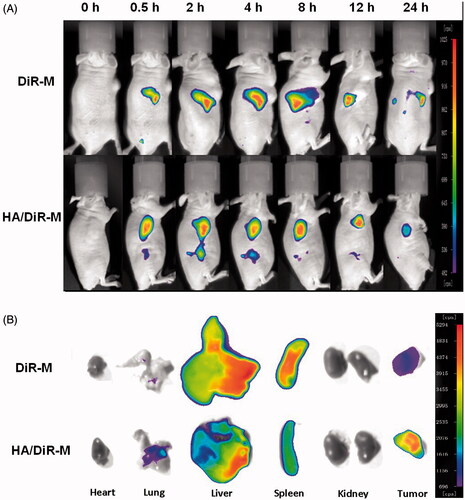
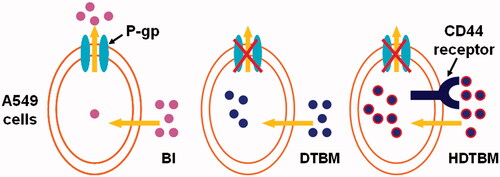
Figure 5. Graphical representation of internalization and accumulation of free drug and micelles modified by TPGS and HA in resistant A549 cells.