Figures & data
Figure 1. (A) Scheme illustrating the engineering approach to dual-drug nanoneedles. (B, C) SEM images showing overview (B) and structural details (C) of nanoneedles, EDC and NHS should be 1-(3-dimethylaminopropyl)-3-ethylcarbodiimide hydrochloride and N-hydroxysuccinimide, respectively.
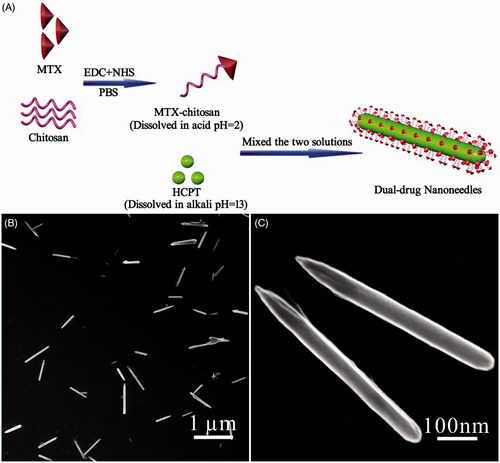
Figure 2. (A–F) Results of intracellular drug delivery in HeLa cells, which were incubated for 8 h at 37 °C. Images A–C, CLSM images of HeLa cells incubated with dual-drug nanoneedles. Nanoneedles were pretreated with FITC for imaging the MTX ingredient. The red (A) and green (B) fluorescent contrasts indicate the presence of MTX and HCPT, respectively. Image C is the combined image of images A and B. Images D–F, CLSM images of HeLa cells incubated with dual-drug nanoneedles (D), HCPT–chitosan nanoneedles (E) and dual-drug nanoneedles in the presence of FA (F). (G) In vitro cell viability of HeLa cells treated with the MTX–chitosan conjugates (a), HCPT–chitosan nanoneedles (b), the theoretical value of MTX–chitosan conjugates and HCPT–chitosan nanoneedles (c), the mixture of MTX–chitosan conjugates and HCPT–chitosan nanoneedles (d) and dual-drug nanoneedles (e) after incubation of 24 h. p < 0.05.
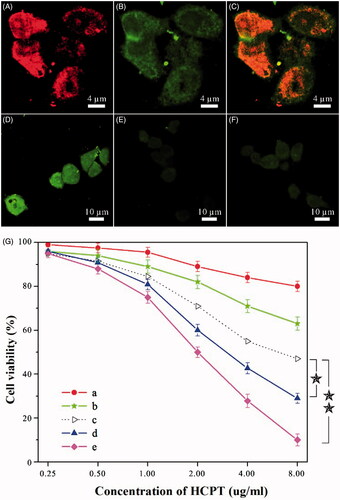
Figure 3. (A) Distribution and tumor accumulation of DiR-nanoparticles in HeLa tumor-bearing mice receiving intravenous injection of the indicated formulations. (B) Ex vivo fluorescence imaging of the tumor and normal tissues harvested from the euthanized HeLa tumor-bearing nude mice. The images were taken 24 h after the injection. H, Li, Lu, K, S and T represent heart, liver, lung, kidney, spleen and tumor, respectively. (C) DiR fluorescence intensity in tumor tissues collected at 24 h following systemic injection. p < 0.05. (a) 0.9% NaCl, (b) DiR-HCPT, (c) DiR-HCPT–chitosan nanoneedles and (d) DiR-dual-drug nanoneedles.
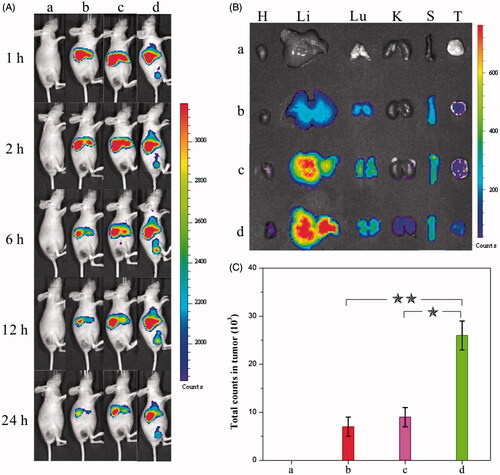
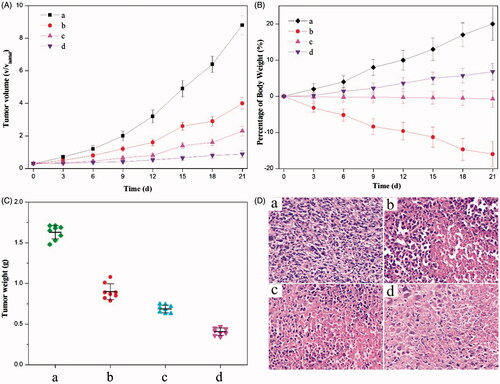
Figure 4. Anticancer effects of different (nano)formulations. (A) Volume change of tumor in mice during the treatment. (B) Weight change of the tumor-bearing mice during the treatment. (C) Weights of HeLa tumors after being treated by different (nano)formulations. (D) Histological section of the tumor of the mice after the treatment. (a) 0.9% NaCl aqueous solution, (b) the crystalline HCPT and MTX mixture, (c) the mixture of HCPT–chitosan nanoneedles and the crystalline MTX and (d) dual-drug nanoneedles. All HCPT–MTX formulations used the same concentration of HCPT and MTX in mice bearing HeLa tumor. p < 0.05.