Figures & data
Figure 1. A polyvinyl chloride tube was fixed with the suture on the sclera of rabbit (a,b); another end of the tube was connected with an auto-infusion pump to infuse the drug to the subternon (c).
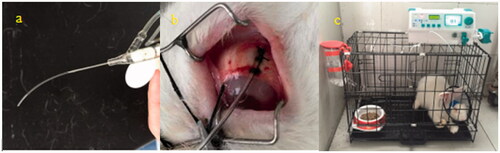
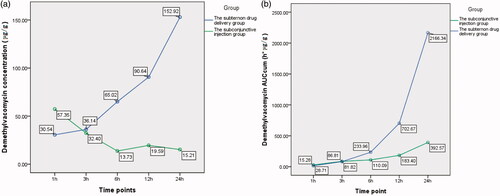
Chart 1. (a) The curve of concentration–time of demethylvancomycin in cornea tissue sequent time points of two groups. (b) The curve of AUCcum–time of demethylvancomycin in cornea tissues at sequent time points of two groups.
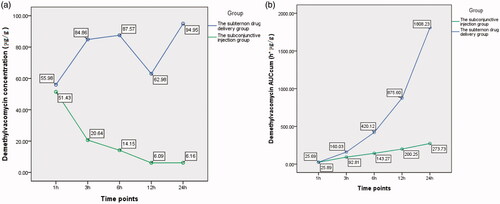
Table 1. The variation of demethylvancomycin concentration in corneal tissue at sequent time points of the two groups (units: μg/g).
Chart 2. (a) The curve of concentration–time of demethylvancomycin in iris tissues at sequent time points of two groups. (b) The curve of AUCcum–time of demethylvancomycin in iris tissues at sequent time points of two groups.
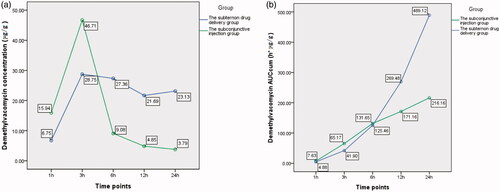
Table 2. The variation of demethylvancomycin concentration in iris tissue at sequent time points of the two groups (units: μg/g).
Chart 3. (a) The curve of concentration–time of demethylvancomycin in sclera tissues at sequent time points of two groups. (b) The curve of AUCcum–time of demethylvancomycin in sclera tissues at sequent time points of two groups.