Figures & data
Figure 1. Formulation screening and technique process optimization of CUR-NSps. (a) Particle size and PDI of CUR-NSps with different ratio of drug to stabilizer (w/w/w); (b) particle size and PDI of CUR-NSps prepared at different temperature. All data represent the mean ± SD (n = 3).
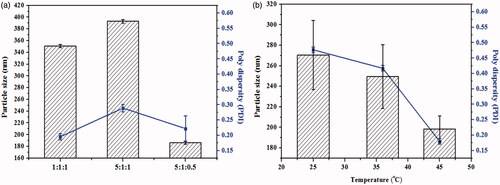
Figure 2. Physical characterization and the stability of CURs-NSps. (a) The particle size of CUR-NSps measured by DLS. (b) TEM micrograph of CUR-NSps. The scale bar is 200 nm. (c) DSC thermograms for 1: CUR-NSps; 2: physical mixture of CUR and excipients; 3: blank excipients; 4: CUR bulk powder. (d) The XRD patterns of 1: CUR-NSps; 2: physical mixture of CUR and excipients; 3: blank excipients; 4: CUR bulk powder. (e) Particle size change of CUR-NSps during the storage at 4 °C for 60 days. (f) Particle size changes of CUR-NSps in normal saline, 5% Glu and PBS at 37 °C. (g) Relative drug content of CUR-NSps and free CUR incubated with plasma at 37 °C. (h) The hemolysis assay of CUR-NSps at different concentrations. From left to right: positive control, negative control, 4 mg/mL, 2 mg/mL, 1 mg/mL, 0.5 mg/mL, 0.25 mg/mL of CUR-NSps.
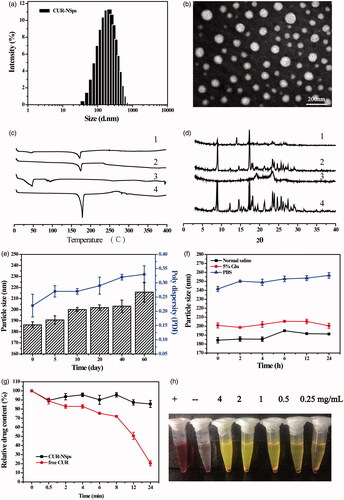
Figure 3. The in vitro antiproliferative activity of CUR-NSps and free CUR solution. (a) Cytotoxicity of CUR-NSps and CUR solution against Hela cells. (b) Cytotoxicity of CUR-NSps and CUR solution against 4T1 cells. (c) Cytotoxicity of CUR-NSps and CUR solution against HCT-8 cells. (d) Cytotoxicity of CUR-NSps and CUR solution against HepG2 cells. All the samples were incubated with cells for 48 h by MTT assay. The results are presented as the mean ± SD, n = 6. *p < 0.05, **p < 0.01, ***p < 0.001.
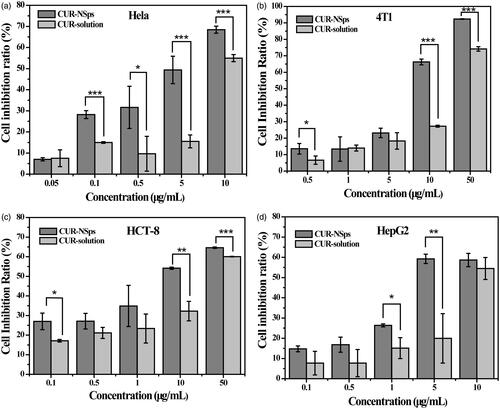
Table 1. IC50 values (μg/mL) of CUR-NSps and free CUR solution against four tumor cell lines after incubation for 48 h.
Figure 4. The mean plasma concentration of CUR after intravenous administration of CUR-NSps and CUR injections at a single dose of 10 mg/kg body weight (mean ± SD, n = 10).
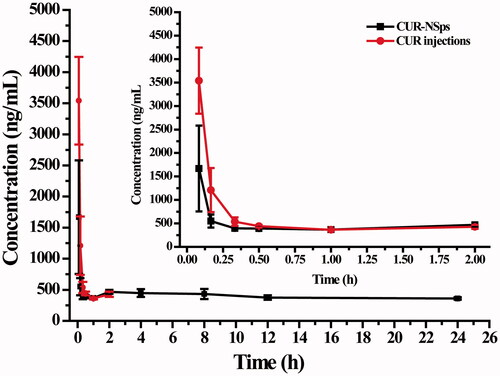
Table 2. Pharmacokinetic parameters after i.v. administration of CUR-NSps and CUR injections.
Figure 5. Biodistribution of CUR after intravenous administration of CUR-NSps and CUR injections in H22 tumor-bearing mice at the same dose of 8 mg/kg body weight (mean ± SD, n = 10).
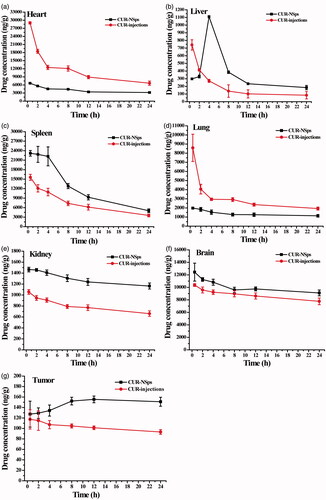
Table 3. AUC0–24 h, MRT and Cmax of the biodistribution of CUR-NSps and CUR injections.
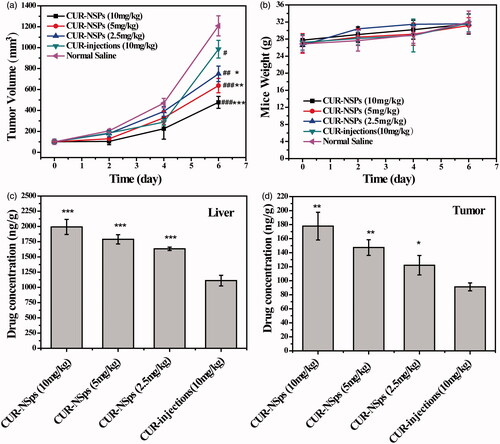
Figure 6. The in vivo antitumor efficacy of CUR-NSps and CUR injections against H22 tumor-bearing mice after intravenous administration. (a) The growth of tumor volume over time. #p < 0.05 versus normal saline, ##p < 0.01 versus normal saline, ###p < 0.001 versus normal saline. *p < 0.05 versus CUR injections, **p < 0.01 versus CUR injections, ***p < 0.001 versus CUR injections. (b) The body weight change of mice with time. (c) The drug concentration of CUR-NSps and CUR injections in liver after multiple intravenous administration. ***p < 0.001 versus CUR injections. (d) The drug concentration of CUR-NSps and CUR injections in tumor after multiple intravenous administration. *p < 0.05 versus CUR injections, **p < 0.01 versus CUR injections. All data represent the mean ± SD, n = 10.