Figures & data
Figure 1. (1) Scheme graph of the construction of FA-DDP/PTX NLCs; (2) TEM image of FA-DDP/PTX NLCs.
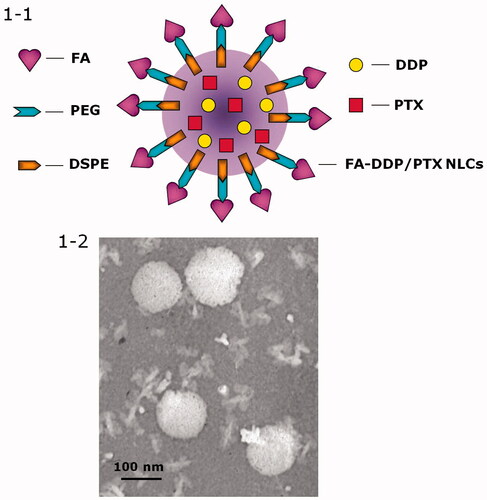
Table 1. Decoration ratio determination.
Figure 2. (1) Changes in size in the presence of serum: (1) FA-DDP/PTX NLCs, (2) DDP/PTX NLCs, (3) PTX NLCs, (4) DDP NLCs; (2-2) changes in DEE in the presence of serum: (1) DDP DEE of FA-DDP/PTX NLCs, (2) PTX DEE of FA-DDP/PTX NLCs, (3) DDP DEE of DDP/PTX NLCs, (4) PTX DEE of DDP/PTX NLCs, (5) PTX DEE of PTX NLCs, and (6) DDP DEE of DDP NLCs.
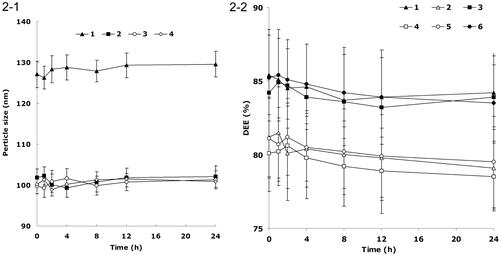
Table 2. Characterization.
Figure 3. (1) In vitro DDP and PTX release at pH 7.4; (2) in vitro DDP and PTX release at pH 5.0: (1) DDP releases from FA-DDP/PTX NLCs, (2) DDP release from DDP/PTX NLCs, (3) PTX release from FA-DDP/PTX NLCs, and (4) PTX release from DDP/PTX NLCs.
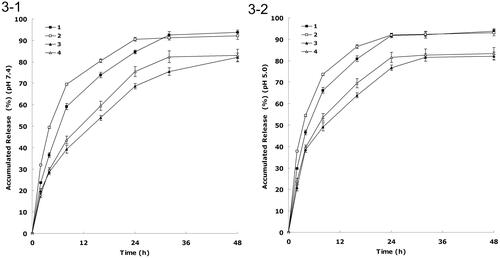
Figure 4. In vitro cell viabilities: (1) FA-DDP/PTX NLCs, (2) DDP/PTX NLCs, (3) PTX NLCs, (4) DDP NLCs, (5) PTX solutions, and (6) DDP solutions.
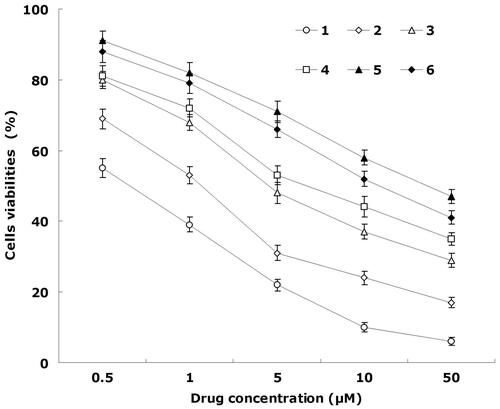
Table 3. The IC50 values and CI50.
Figure 5. (1) In vivo DDP tissue distribution of FA-DDP/PTX NLCs; (2) in vivo PTX tissue distribution of FA-DDP/PTX NLCs.
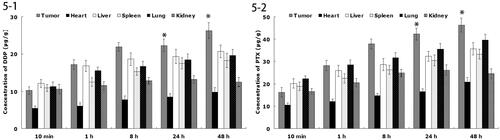
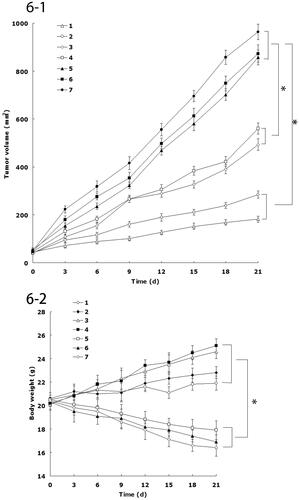
Figure 6. (1) The tumor growth curves; (2) body weight change curves: (1) FA-DDP/PTX NLCs, (2) DDP/PTX NLCs, (3) PTX NLCs, (4) DDP NLCs, (5) PTX solutions, (6) DDP solutions, and (7) 0.9% saline.