Figures & data
Figure 1. Synthetic scheme of PCur conjugate (A); representative 1H NMR (B) and FT-IR (C) spectra of original reactants (PEG and Cur) and the final product (PCur).
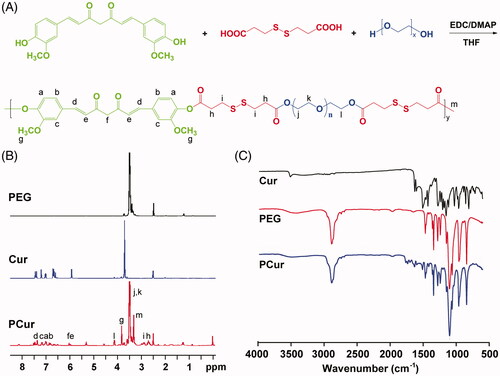
Figure 2. DSC thermograms of PEG, Cur, physical mixture (PM) and PCur conjugate (A); particle size distribution and morphology of PCur conjugate measured by DLS and TEM, respectively (B). Scale bar is 200 nm.
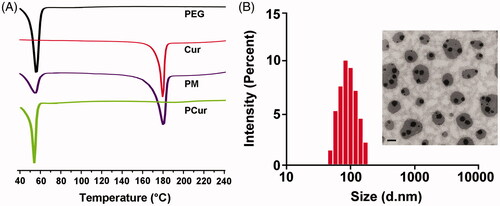
Figure 3. Reduction triggered Cur release from PCur conjugate in the presence of GSH and cecal suspension (A); in vitro release profiles of PCur conjugate under different pH conditions (pH 7.4, 6.5 and 1.2) (B); all data represent as mean ± SD (n = 3).
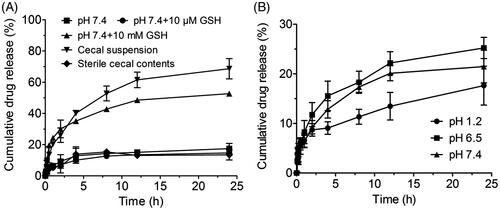
Figure 4. Real-time changes of PCur conjugate in size under pH 1.2 and 7.4 in absence/presence of 10 mM GSH (A); the morphology of PCur conjugate examined by TEM after incubation with 10 mM GSH for 12 h (B).
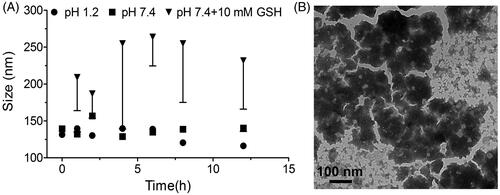
Figure 5. In vitro cytotoxicity (A) and LDH release assays (B) of Caco-2 cells after 2 h incubation with Cur solution and PCur, respectively; the apparent permeability coefficient (Papp) of Cur suspension and PCur against Caco-2 cells (C).
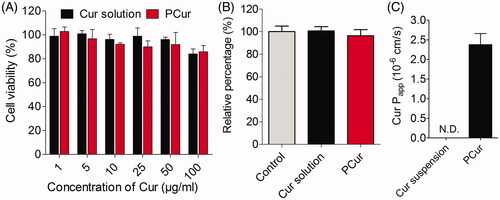
Figure 6. (A) Plasma concentration–time curves of Cur suspension and PCur after oral administration at the dose of 50 mg/kg Cur (n = 6); (B) HPLC analysis: (1) Cur (5 μg/mL), (2) PCur (100 μg/mL), (3) intestinal perfusate from mice receiving PCur, (4) PEG, (5) blank intestinal perfusate from mice receiving PBS; (C) quantitative assay of Cur in mucous and muscular layers from different intestinal segments, *p < 0.05 versus other groups.
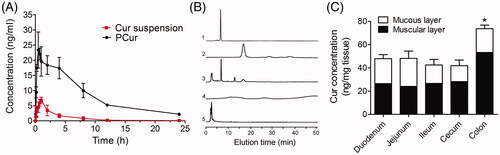
Table 1. Pharmacokinetic parameters of Cur after oral administration Cur suspension and PCur (50 mg/kg Cur, mean ± SD, n = 6).
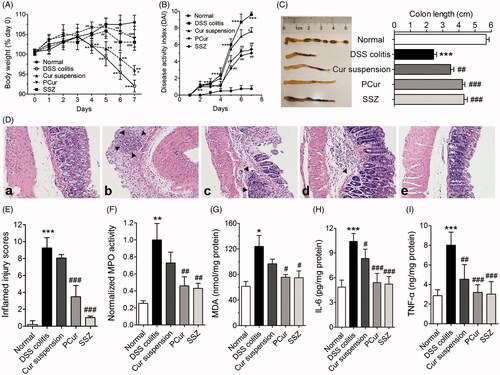
Figure 7. Orally administered PCur protected mice from DSS-induced IBD. Change in body weight (A), DAI evaluation (B) and colon length (C) of normal mice and DSS-induced mice receiving different treatments; (D) histological sections of colon from normal mice (a), DSS-induced mice (b), DSS-induced mice treated with Cur suspension (c), PCur (d) and SSZ (e) by stained with H&E; black arrow represented inflammatory infiltration; quantitative scores of inflamed degree (E); effects of PCur administration on MPO activity (F), MDA content (G), IL-6 (H) and TNF-α (I) levels in colonic tissues. *p < 0.05, **p < 0.01, ***p < 0.001 versus normal group, #p < 0.05, ##p < 0.01, ###p < 0.001 versus DSS-induced group.