Figures & data
Table 1. Composition, entrapment efficiency, vesicle diameter and ex vivo permeation parameters of TIZ-loaded nanotransfersomes.
Figure 1. In vitro release profiles of TIZ from drug solution and transfersomal formulae: (A) F1–F6 and (B) F7–F12.
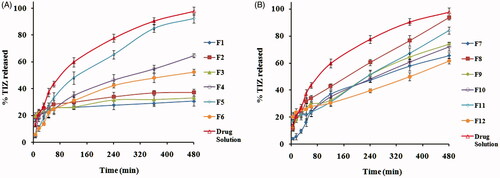
Figure 2. Transmission electron micrograph of freshly prepared transfersomal formula F5.
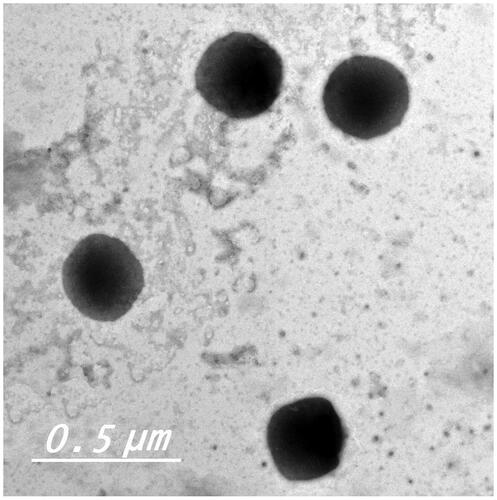
Figure 3. Morphology of rabbit rectal mucosa: (A) control, (B) 8 h after administration of FG and (C) 8 h after administration of TG.
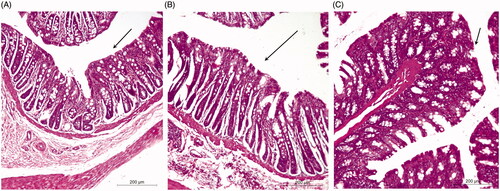
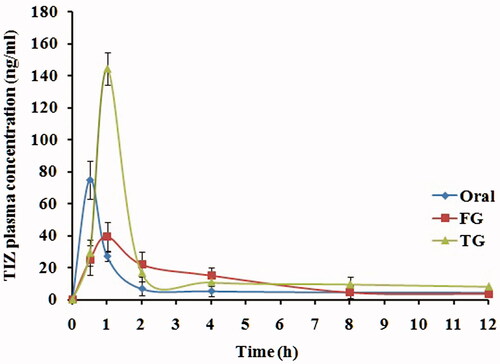
Figure 4. Mean TIZ concentrations in rabbit plasma following administration of oral solution, rectal TIZ in situ gel (FG) and rectal transfersomal in situ gel (TG).