Figures & data
Figure 1. Size distribution of PTX-TP-M (panel A); TEM micrographs of PTX-TP-M (panel B); schematic illustration of the structure of PTX-TP-M (panel C). Scale bar = 100 nm.
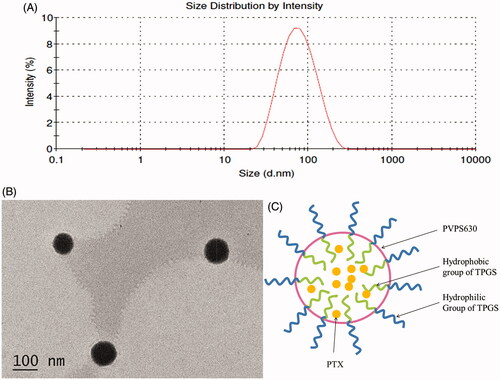
Table 1. Characteristics of PTX-loaded mixed micelle system.
Figure 2. In vitro PTX release profiles from PTX-loaded mixed micelles and free drug at 37 °C over 48 h. Data are expressed as mean ± SD (n = 3).
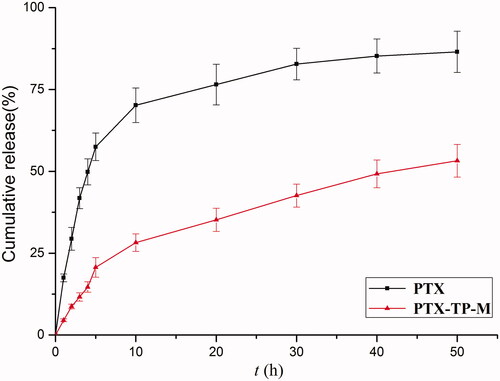
Figure 3. Schematic illustration of PTX-TP-M inhibits the efflux system and contributes to absorption.
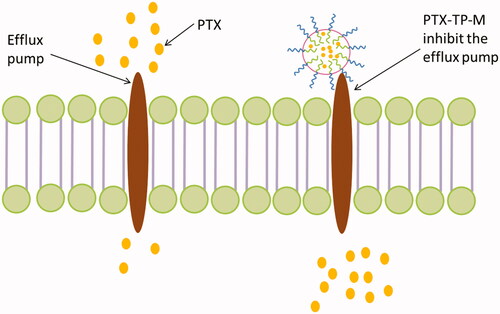
Table 2. Permeability and efflux ratio of PTX and PTX-TP-M.
Figure 4. The plasma concentration-time curve of PTX in rats after oral administration of PTX, PTX-loaded mixed micelles (20 mg/kg, IS). Data are presented as mean ± SD (n = 6).
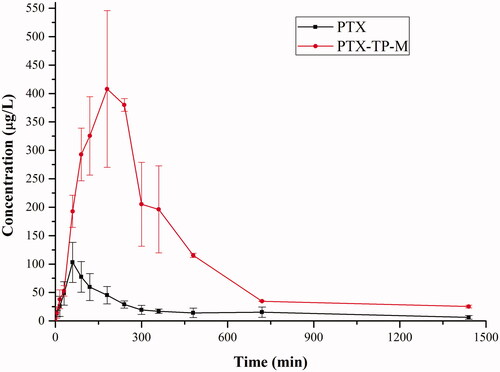
Table 3. Pharmacokinetic parameters of PTX and PTX-TP-M (20 mg/kg, PTX).
Table 4. IC50 values against A549 and Lewis cells after 24-h treatment.
Figure 5. Tumor volumes of C57BL/6 mice implanted with Lewis cells in control, PTX, PTX-TP-M groups (panel A). The results are presented as the mean ± SD (n = 6); pathological section images of the tumor tissues of control and Lewis tumor-bearing C57BL/6 mice treated by PTX and PTX-TP-M (panel B). Scale bar = 20 or 50 μm.
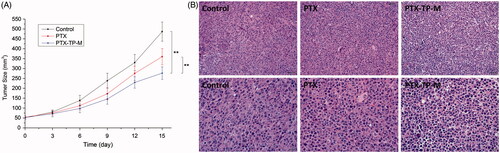
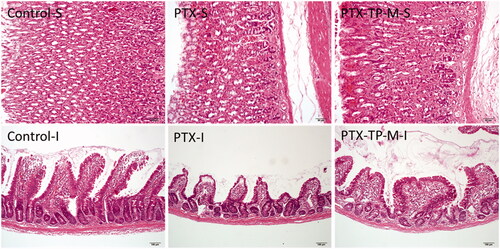
Figure 6. Gastrointestinal safety assay observed by H&E staining. (S) Stomach and (I) Intestine.