Figures & data
Figure 1. The in vitro release of SFN from MSNM@SFN at 37 °C in pH 1.2 (A) and 6.8 (B) PBS buffer medium. Data represent the mean ± SD (n = 3).
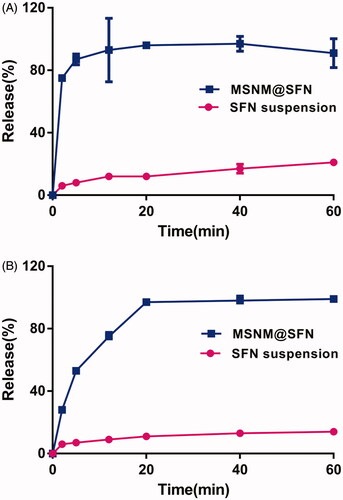
Figure 2. The plasma concentration-time profiles of SFN after oral administration of a single dose of SFN suspension or MSNM@SFN at 20 mg/kg SFN in SD rats (mean ± SD, n = 6).
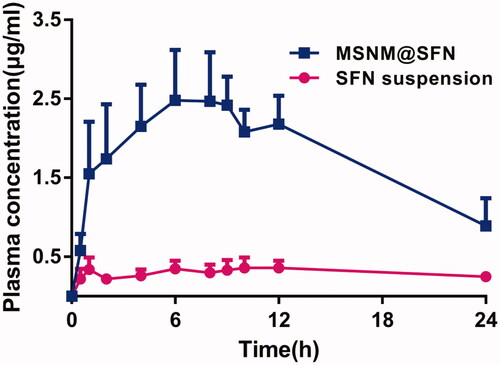
Table 1. Pharmacokinetic parameters of SFN after oral administration of a single dose of SFN suspension or MSNM@SFN at 20 mg/kg SFN in SD rats (mean ± SD, n = 6).
Table 2. The IC50 values (μM) of MSNM@SFN in MDA-MB-231 cells (mean ± SD, n = 3).
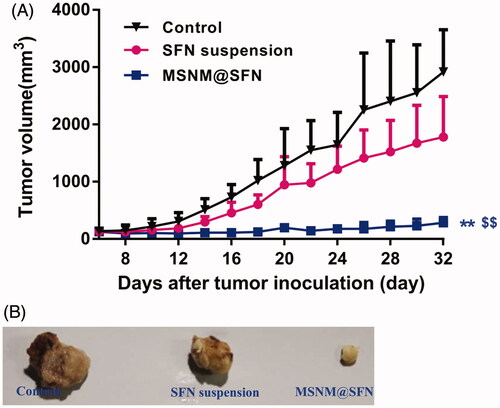
Figure 3. In vivo anti-tumor activity of MSNM@SFN in MDA-MB-231 tumor-bearing nude mice (mean ± SD, n = 6). BALB/C nude mice were inoculated SC with MDA-MB-231 cells and treated with physiological saline as a control, SFN suspension (40 mg/kg) and MSNM@SFN (SFN 40 mg/kg) by oral gavage every day. The tumors were measured with calipers every 2 days throughout the study. A: Tumor growth. B: The photographs of the typical tumors. **p < 0.01 versus the physiological saline treatment group as a control. $$p < 0.01 versus the SFN suspension treatment group.