Figures & data
Figure 1. The characteristics of endostatin-loaded nanoparticles. (A) The fabrication process of ES-NPs. Endostatin-loaded chitosan nanoparticles were prepared by ionic cross-linking method with dropwise addition of TPP to a chitosan solution. (B) The size distribution of our chosen ES-NPs. The results showed that the particles were 246.89 ± 3.5 nm in diameter. (C) The release behavior of ES-NPs in vitro. The endostatin release profile was biphasic, with an initial abrupt release and a subsequent sustained release. (D) The formulation stability of ES-NPs in mouse serum at 4 °C, 37 °C or room temperature (RT). (E) TEM images of ES-NPs. Transmission electron microscopy showed that nanoparticles were round particles with relative smooth edges.
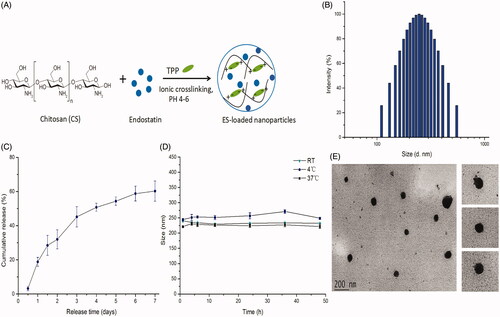
Table 1. Characteristics of four endostatin-loaded nanoparticles.
Figure 2. The effects of ES-NPs on cell viability in vitro. HUVECs were treated with ES (200 μg/mL), ES-NPs (contained 200 μg/mL ES) or blank CS NPs for 24 h, 48 h and 72 h. The data showed that ES-NPs had strong effect on inhibiting the proliferation of HUVECs.
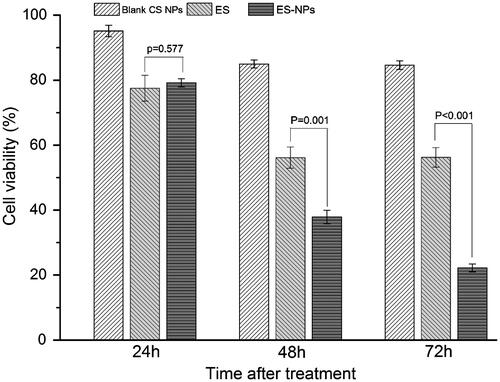
Figure 3. The effects of ES-NPs on cell migration in vitro. The cells were incubated with PBS, ES, ES-NPs or blank CS NPs for 12 h and 24 h. The data showed that ES-NPs had a significant effect on HUVECs migration. ap < 0.05 versus control; bp < 0.05 versus ES group.
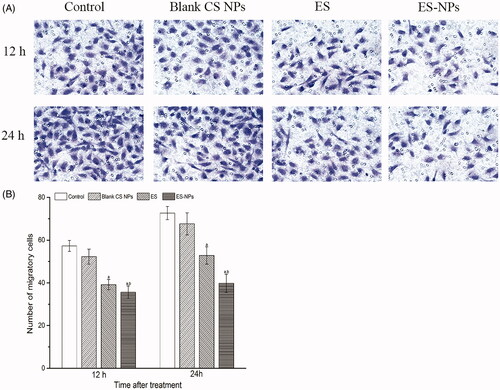
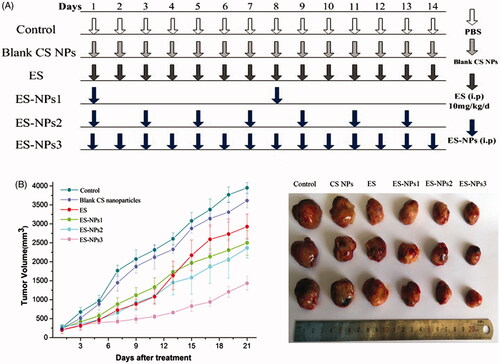
Figure 4. Tumor volume changes in each group. (A) Treatment schedule. Two weeks after inoculation, the tumor-bearing mice were randomly assigned to six groups: control, ES, ES-NPs1, ES-NPs2, ES-NPs3 and blank CS nanoparticles (n = 10). (B) Tumor growth curve in each group. (C) The final tumor volume on day 21.
Figur 5. The microvascular density (MVD) in each group. (A) Tumor vessels were stained darkly by CD31 antibody as arrows indicated (×400). (B) Histogram of mean microvascular density in each group. ap < 0.05 versus control; bp < 0.05 versus ES group.
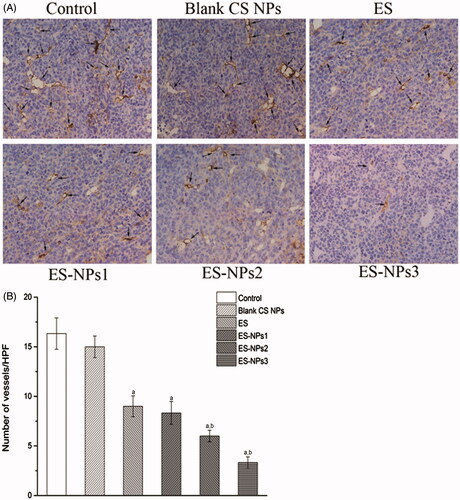
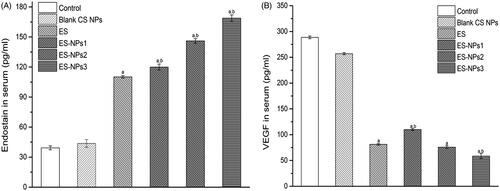
Figure 6. The serum endostatin (A) and VEGF (B) levels of each group. Mice in each group were sacrificed on day 21, and the blood samples were collected to detect the serum endostatin and VEGF levels by ELISA. ap < 0.05 versus control; bp < 0.05 versus ES group.