
Figures & data
Figure 1. Measurements of nanobubbles (NBs) with different gases. C3F8 is perfluoropropane gas, C4F10 is perfluorobutane gas and N2 is nitrogen gas. (A) Mean bubble size (n = 3; mean ± SEM). (B) Size distribution histograms.
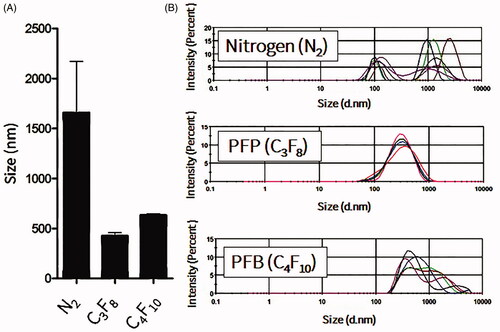
Figure 2. The effects of lipid concentrations on nanobubble (NB) size, distribution and stability at room temperature. (A) Size of freshly prepared NBs (n = 3). (B) NBs after storage for 24 h at room temperature (n =3).
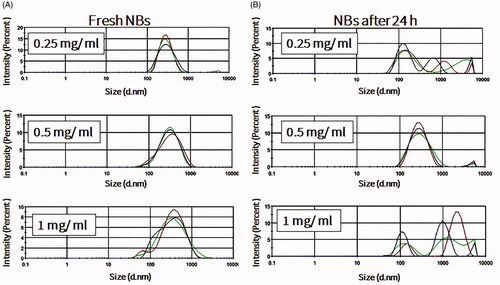
Figure 3. Measurements of nanobubbles (NBs) made with perfluoropropane gas (C3F8) and left at atmospheric pressure for different time points. (A) NB size distribution histograms; 10 measurements over 25 h. (B) The visual appearance of NBs at 0, 3 and 25 h post exposure of the NBs to the atmospheric pressure conditions.
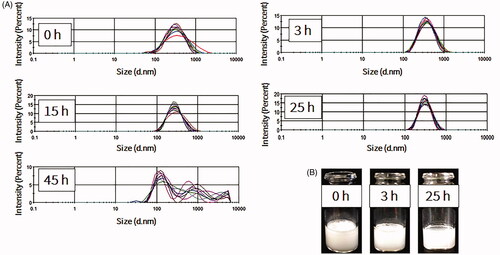
Figure 4. Measurements of nanobubbles (NBs) made with perfluoropropane gas (C3F8) and left at 4 °C for different time points (n = 10).
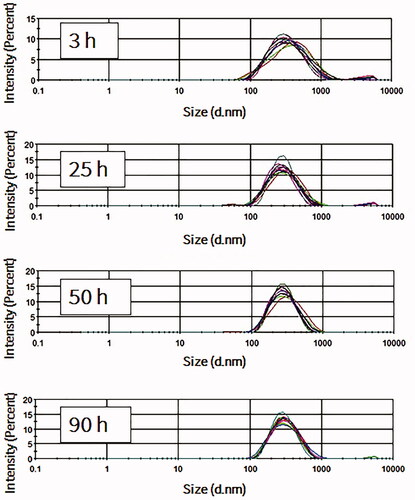
Figure 5. Optical images of nanobubbles (NBs). (A) Freshly prepared NBs. (B) NBs that were kept at 4 °C for 90 h. (scale bar, 5 μm).
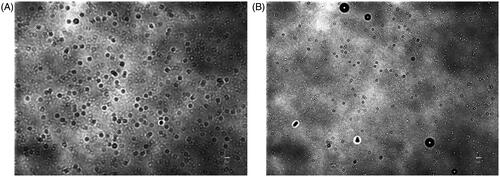
Figure 6. In vitro gene expression and cellular damage in C26 cells after various treatments with pDNA. (A) In vitro gene transfection. (B) WST-1 assay. Colon C26 cells were treated with nanobubbles (NBs) with pDNA and ultrasound (US) irradiation. Fifteen hours after transfection, cells were harvested and the level of luciferase was evaluated in addition to a WST-1 assay. Each bar represents the mean ± SEM of 3–5 experiments. *p < 0.05 versus the corresponding group of no treatment (NT).
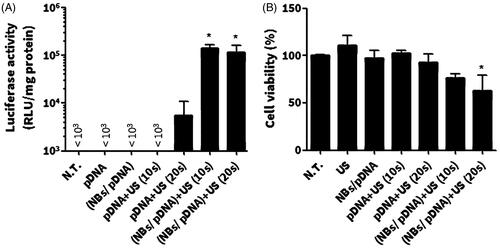
Figure 7. In vivo gene transfection in mice limb muscles. (A) The effect of the dose of the nanobubble (NB) on enhancing the gene expression. (B) Tissue selective gene expression. After the intravenous injection of NBs/pDNA, the left muscle was irradiated via ultrasound (US). Each bar represents the mean ± SEM of 3–6 experiments. *p < 0.05 versus the corresponding group of pDNA/US, **p < 0.0001 versus all tissues.
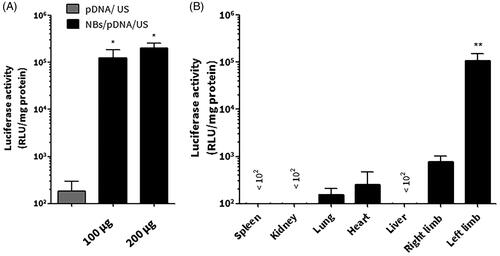
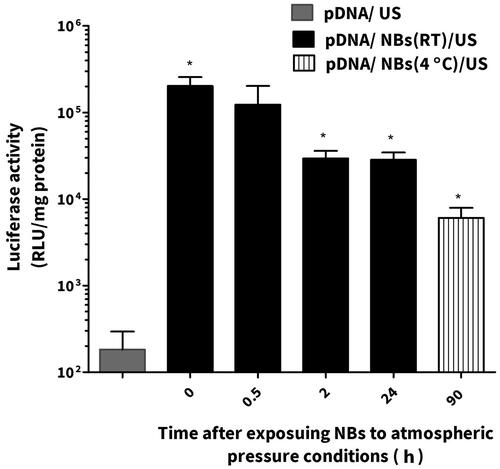
Figure 8. The effect of nanobubble (NB) stability on the in vivo gene expression. Each bar represents the mean ± SEM of 3–5 experiments. *p < 0.05 versus the corresponding group of pDNA/US.