Figures & data
Figure 1. The transmission electron microscope (TEM) photograph of PTL (Scale bar = 0.5 μm).
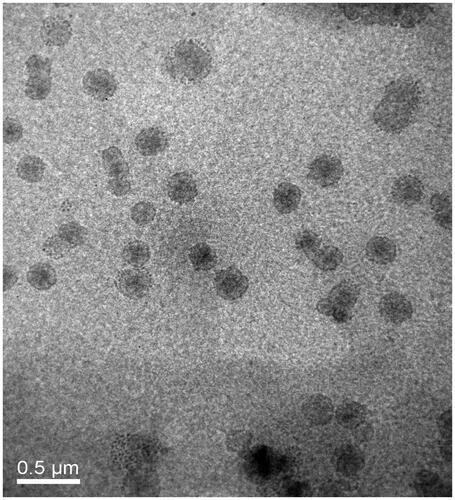
Figure 2. The variations in turbidity (represented by absorbance) of PTL in 10% FBS and 50% FBS. The results were represented as means ± SD (n = 3).
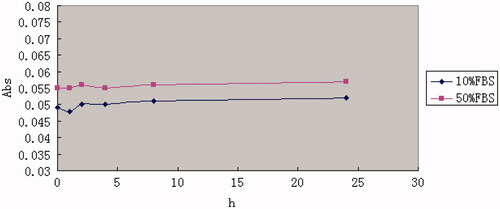
Figure 3. Cell viabilities in MCs with the treatments of different liposomes with different lipid concentration from 0.05 to 0.8 mM. The lipid concentrations were from 0.05 to 0.8 mM. The results are represented as means ± SD (n = 3). ##p < 0.01; ###p < 0.001 versus no treatment.
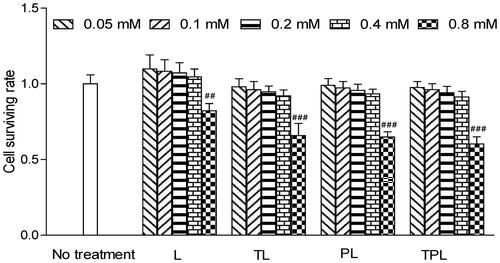
Table 1. Results of the particle size, PDI, zeta-potential and encapsulation efficiency of various liposomes.
Table 2. The variations in particle size, PDI, zeta-potential and encapsulation efficiency of PTL in 4 °C PBS between day 0 and day 30.
Figure 4. Cellular uptake of L, TL, PL and PTL on MCs. (A) The uptake of four kinds of liposomes loaded coumarin-6 by the MCs were determined by flow cytometry. (B) The cellular uptake was investigated quantitatively. The results were represented as means ± SD (n = 3). **p < 0.01; ***p < 0.001 versus PTL.
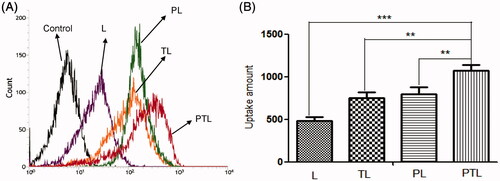
Figure 5. Cellular uptake of L, TL, PL and PTL on MCs. Four kinds of liposomes loaded coumarin-6 showed green autofluorescence and their uptake by the MCs recorded by confocal microscopy. Cell nuclei were stained blue with DAPI. Bar = 20 μm.
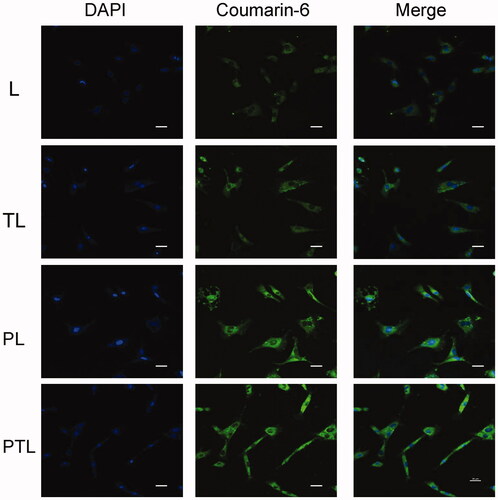
Figure 6. Cellular uptake of TL and PL on MCs pre-incubated by free TAT or PCM peptides. (A) The uptake of two kinds of liposomes loaded coumarin-6 by the MCs were determined by flow cytometry. (B) The cellular uptake was investigated quantitatively. The results were represented as means ± SD (n = 3). ***p < 0.001, ns: no significant difference.
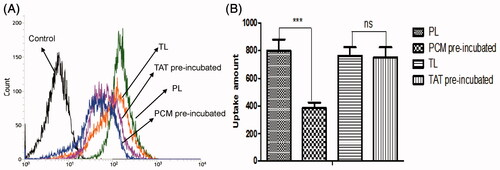
Figure 7. The confocal microscopic images of frozen sections of mouse heart. Four kinds of liposomes loaded coumarin-6 showed green autofluorescence and their uptake by the myocardium recorded by confocal microscopy. Cell nuclei were stained blue with DAPI. Bar = 100 μm.
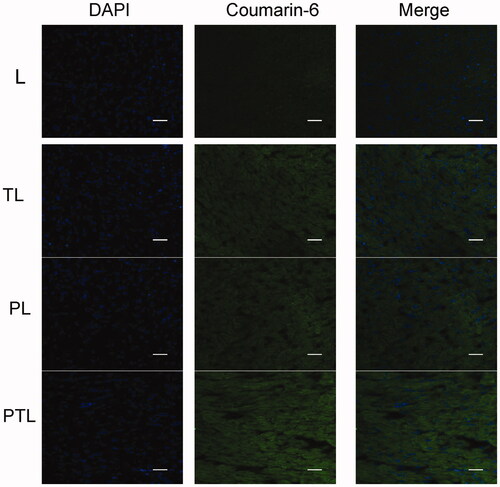
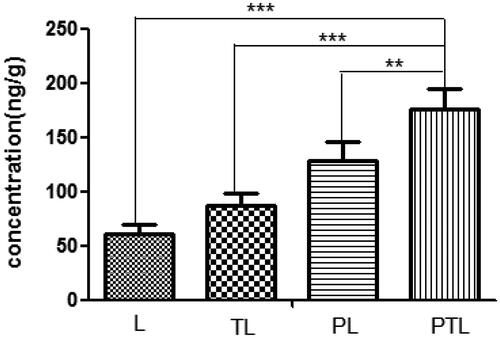
Figure 8. The amount of L, TL, PL and PTL accumulated into the mouse heart detected by high performance liquid chromatography assay (HPLC). The results were expressed as the weight ratio of coumarin-6 and heart (ng/g) and represented as means ± SD (n = 3). **p < 0.01; ***p < 0.001 versus PTL.