Figures & data
Table 1. Formulation composition, % yield, drug loading and loading efficiency of different formulations.
Figure 1. FTIR spectral data of (A) DTX, (B) CHL and (C) SPC, (D) a mixture of CHL, SPC and (E) a mixture of drug with CHL, SPC, (F) the optimized formulation with DTX (L-DTX) and (G) formulation without DTX (B-DTX).
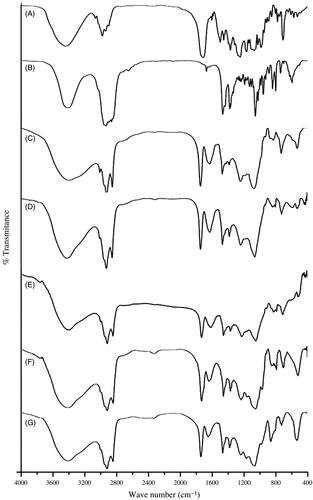
Figure 2. (A) Particle size distribution (B) Zeta potential value (C) Field emission scanning electron microscopic image at a magnifications of (70 000×) and (D) Cryo-TEM image of the experimental formulation (L-DTX).
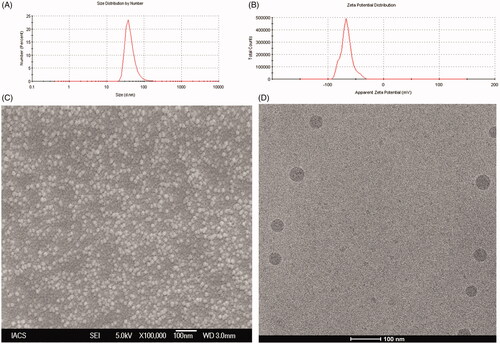
Figure 3: (A) In vitro release profile of DTX from the experimental formulation (L-DTX), marketed formulation (Taxotere®) and free-DTX solution in phosphate buffer, pH 7.4. Data show mean ± standard deviation of three different experiments in triplicate. (B) Cell viability study by MTT assay of blank formulation (B-DTX), L-DTX (formulation with DTX), marketed preparation (Taxotere®) and free-drug (DTX) in C6 glioma cells of rats. Data show mean ± standard deviation of three different experiments. (C) Cellular localization study of FITC-L-DTX (F-DTX) at different time points by fluorescence microscopy in C6 glioma cells of rats and (D) Flow cytometric measurement of C6 glioma cells of rats incubated with F-DTX at 0.5 h and 6 h of treatments, indicating about 18%, and about 23% enhancement of uptake in terms of FITC incorporated liposomes in cells at 0.5 h () and 6 h () of treatments, respectively, in comparison to untreated cells ().
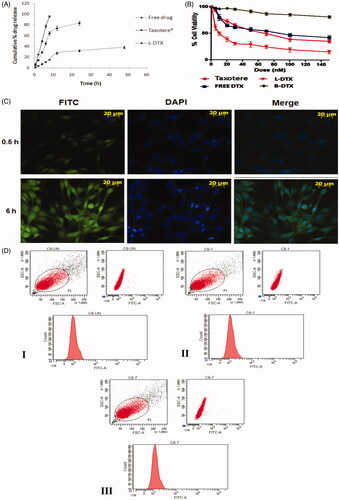
Table 2. Pharmacokinetic parameters and plasma to brain values in different groups of rats treated with DTX-loaded liposome (L-DTX), marketed formulation of DTX (Taxotere®) and free-drug (DTX), administered intravenously at a dose of 10 mg/kg of average body weight of the rats.
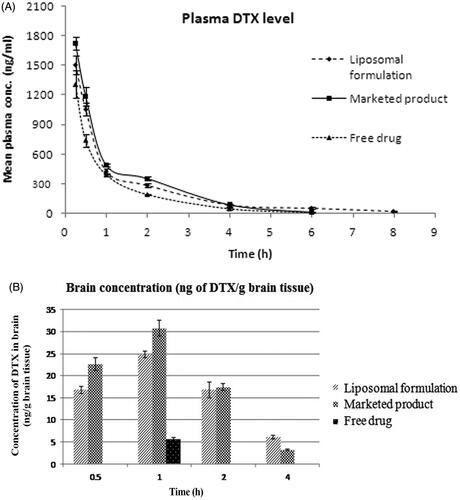
Figure 4: (A) Plasma level of DTX in rats after intravenous administration of L-DTX, free drug and Taxotere®. (B) Concentration of DTX in brain after intravenous administration of nanoliposomal formulation containing DTX (L-DTX), marketed formulation (Taxotere®) and free drug to rats at a dose of 10 mg/kg of DTX. Note: Data show mean ± standard deviation (n = 3).