Figures & data
Table 1. Biochemical parameters for the control group and CMX–DOX under the OMF group.
Figure 1. TEM image of (A) fluidMAG-CMX particles; (B) fluidMAG-CMX with positive staining by uranyl acetate. Particle size distribution by DLS of (C) fluidMAG-CMX; (D) CMX–DOX.
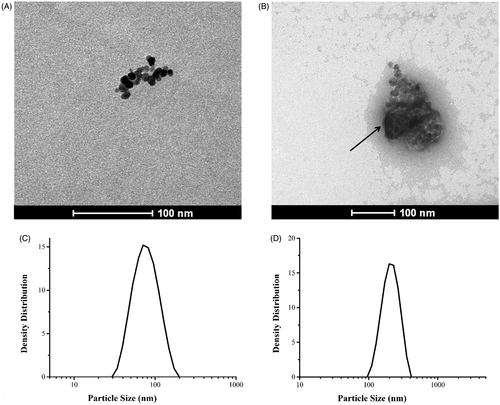
Figure 2. (A) FTIR spectra of DOX, CMX, and CMX–DOX. (B) Confocal microscopic image of CMX–DOX.
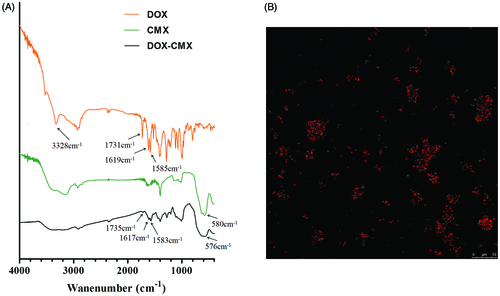
Figure 3. In vitro drug release under different conditions (PBS group, crude protease group, and OMF group).
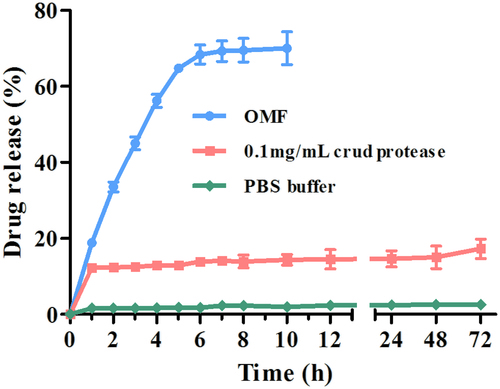
Figure 4. Switched turn-off and turn-on release of CMX–DOX under an OMF.
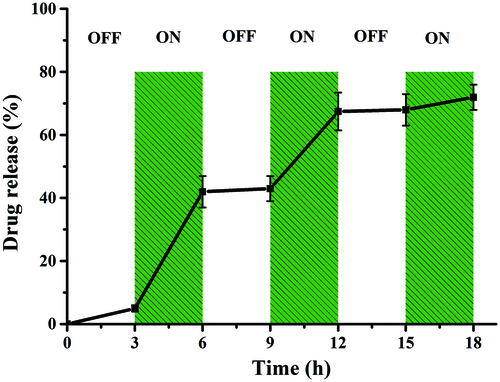
Figure 5 Cell viability of Hela cells in the absence or presence of OMF after treatment with CMX–DOX NPs by MTT assay, DOX as a positive control.
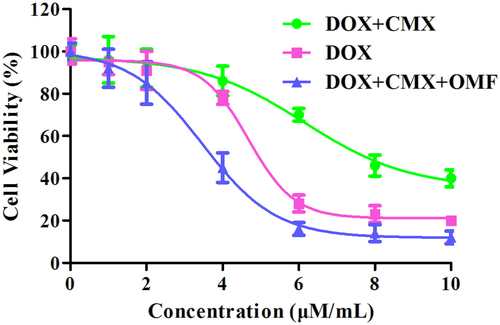
Figure 6. Growth of tumor after various treatments over 21 days. (A) Representative photos of tumors after various treatments, taken 21 days after treatment. a. control group, b. free DOX and c. CMX–DOX under OMF. (B) The average changes in tumor volume over 21 days after different treatments, including the PBS group, CMX without OMF group, free DOX group, CMX–DOX without OMF group, CMX–OMF group, CMX–DOX–OMF group, as well as control group.
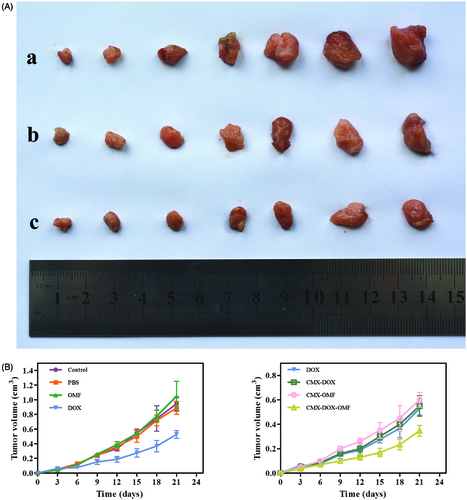
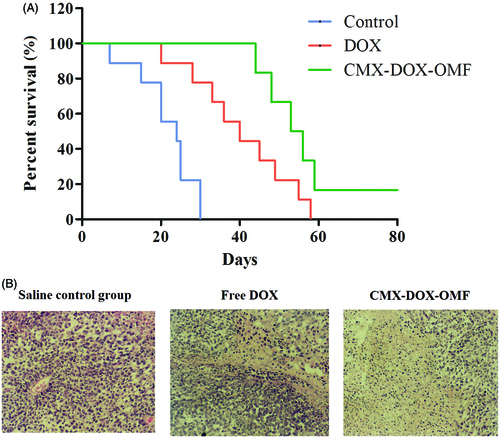
Figure 7. (A) Survival curves of various groups of mice after different treatments. (B) Detection of apoptosis with hematoxylin and eosin (H&E) staining in tumor tissues (×100).