Figures & data
Figure 1. Schematic illustration of the synthesis scheme of MPEG-PCL, the formation of polymeric micelles from MPEG-PCL/DA, and schema of hemisection of rat SCI model (A: Preoperative; B: Postoperative).
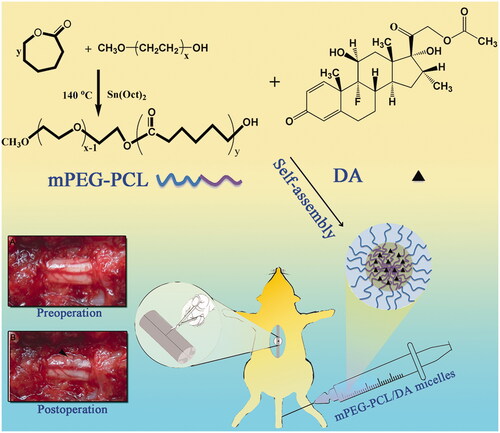
Figure 2. Preparation and characterization of DA-M. (A) Proton nuclear magnetic resonance spectra of MPEG-PCL; (B) Photographs of several solutions. (a) Water; (b) DA aqueous solution; (c) blank MPEG-PCL micelles at the concentration of 20 mg/ml (w/v); (d) DA-loaded micelles at the concentration of 20 mg/ml (w/v); (e) freeze-dried blank MPEG-PCL micelles; (f) freeze-dried DA-loaded micelles; (g) redissolved resolution of freeze-dried DA-loaded micelles at the concentration of 10 mg/ml (w/v); (C) zeta potential of DA-M; (D) particle size distribution of DA-M; (E) TEM image of DA-M.
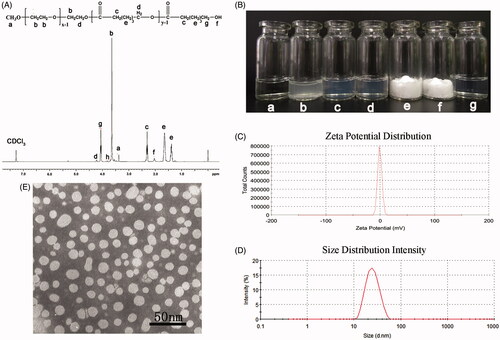
Table 1. Drug loading, encapsulation efficiency and stability time of micelles at various weight ratios.
Figure 3. (A) FT-IR spectra of (a) DA, (b) freeze-dried of MPEG-PCL/DA micelles powder and (c) freeze-dried MPEG-PCL micelles powder; (B) X-Ray diffraction spectra of (a) DA; (b) MPEG-PCL; (c) freeze-dried MPEG-PCL/DA micelles powder; (d) DA mixture with MPEG-PCL powder.
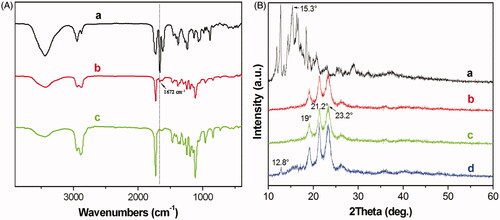
Figure 4. Drug release profiles of free DA and DA-loaded micelles in PBS solution at pH = 7.4.
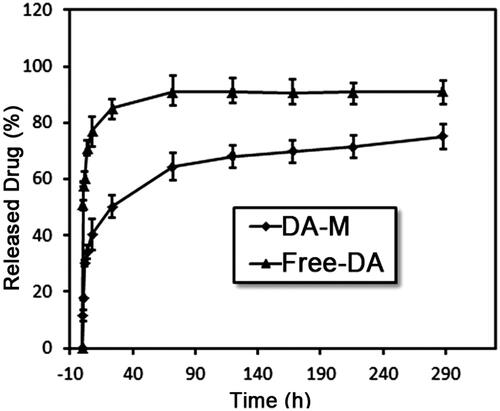
Figure 5. Magnetic resonance images of hemisection of rat SCI at 1 week and 1 month of post operation. White arrows indicate the site of injury.
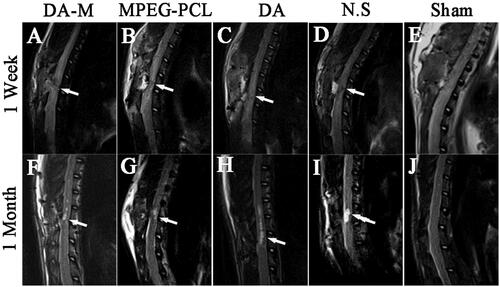
Figure 6. BBB locomotor scores of each group at 1 week, 2 weeks, 1month and 3 months. Significance was assessed compared to the other groups for each time point assayed by one-way analysis of variance. Quantitative data are represented as mean ± SD. p Values less than 0.05 were considered significant (*p < 0.05).
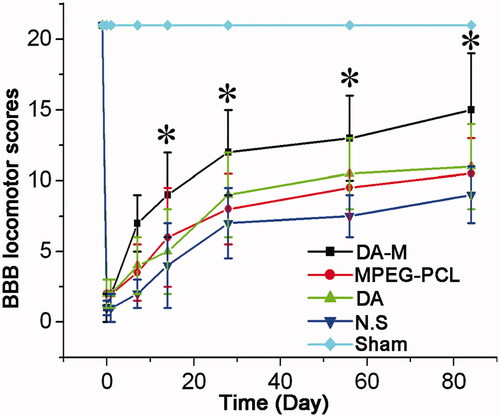
Figure 7. Representative photos of injured spinal cord in each group at 1 week, 2 weeks, 1month and 3 months.
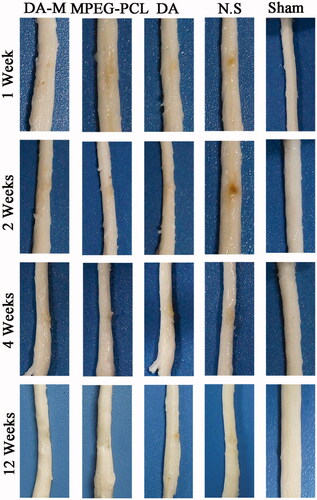
Figure 8. Photograph of injured spinal cord with hematoxylin-eosin stain in each group at 1 week, 2 weeks, 1month and 3 months (A–T). Quantitative comparison of the lesion volumes in DA-M-treated and other groups (U). Significance was assessed compared to the other groups for each time point assayed by one-way analysis of variance. Quantitative data are represented as mean ± SD. p Values less than 0.05 were considered significant (*p < 0.05). Scale bars represent 200 μm.
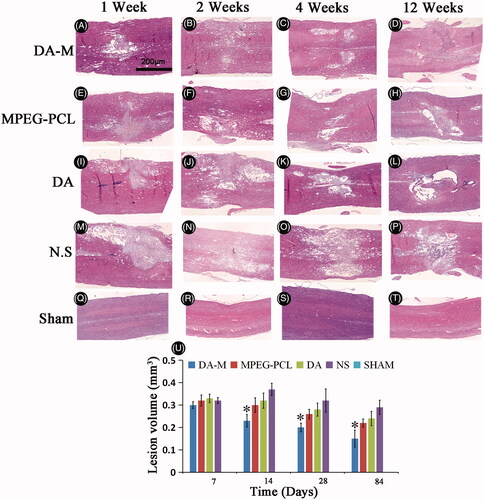
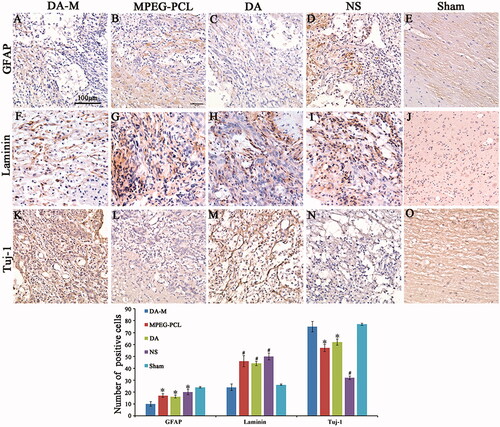
Figure 9 (A–E). GFAP, (F–J) Tuj-1 and (K–O) laminin immunohistochemical analysis. Spinal cord sections from the groups treated with intravenous DA-M, free DA, blank MPEG-PCL micelles and normal saline (NS) were subjected to immunohistochemistry to detect GFAP, Tuj-1 and laminin. (P) Quantification comparison of GFAP, laminin and Tuj-1positive cells in DA-M-treated and other groups. Significance was assessed by one-way analysis of variance. Quantitative data are represented as mean ± SD. p Values less than 0.05 were considered significant (*p < 0.05, #p < 0.01). Scale bars represent 100 μm.