Figures & data
Table 1. Physicochemical characterization of the NLCs.
Figure 1. The characterization of formulated SV/NLCs. (A) Representative TEM images of formulated SV/NLCs (bar = 100 nm). (B) In vitro release profile of simvastatin from NLCs. The data represent the mean ± SD (n = 3).
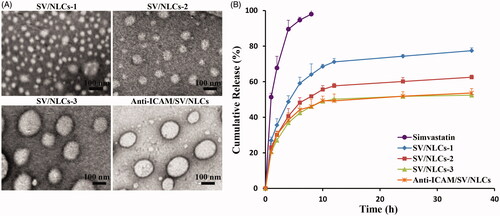
Figure 2. The cytotoxicity and cellular uptake of NLCs against EAs. The cells viability influence of blank NLCs (A) and SV/NLCs (B) against EAs after incubation for 48 h. (C) Cellular uptake of FITC-labeled SV/NLCs (bar = 100 μm). (D) The semi-quantitative analysis of cellular uptake by the software “Image J”. The data represent the mean ± SD (n = 3).
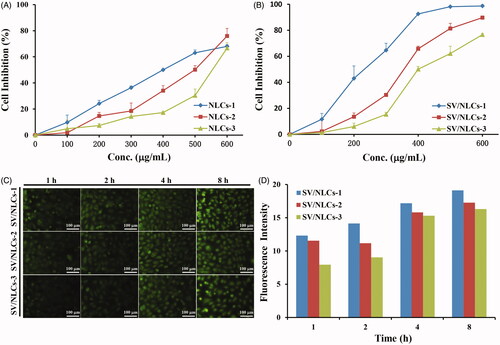
Figure 3. In vivo bio-distribution of non-targeted NLCs. (A) The fluorescence images of excised representative organs from mice. Where A1, A2 were the images of lung tissues merely observed in the same field of vision; A3, A4 were the images of the whole representative organs observed in the same field of vision. (B) The semi-quantitative fluorescence intensity in the organs, expressed as the average fluorescence intensity (avg signal/counts).
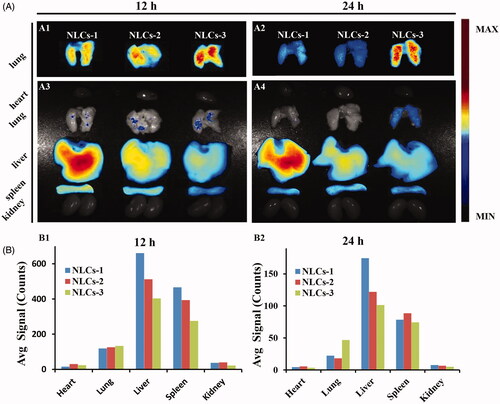
Figure 4. In vivo bio-distribution of anti-ICAM/SV/NLCs. (A) The fluorescence images of excised representative organs from mice. The column in each image sequentially showed the anti-ICAM/SV/NLCs bio-distribution in the representative organs of the healthy mice, saline-challenged mice and LPS-induced mice, from left to right. The non-targeted SV/NLCs-3 bio-distribution in the LPS-induced mice was reflected in the leftmost column. (B) The semi-quantified fluorescence intensity in the representative organs, expressed as the average fluorescence intensity (avg signal/counts).
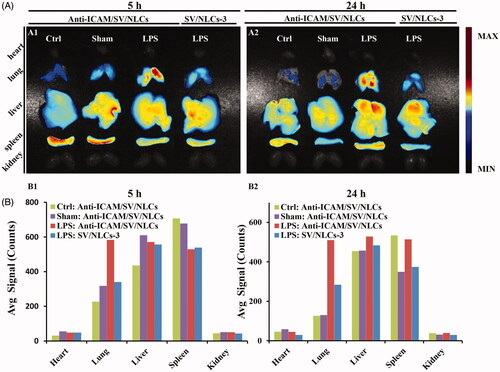
Figure 5. The cellular uptake of anti-ICAM/SV/NLCs. (A) The representative immunofluorescence images revealed the expression of ICAM-1 on EAs (bar = 20 μm). (B) The quantitative analysis of ICAM-1 targeting characteristic of anti-ICAM/SV/NLCs in vitro by a flow cytometer.
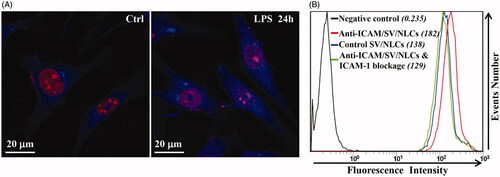
Figure 6. In vivo anti-inflammatory assessments. (A) Treatment schedule. (B) TNF-α level. (C) IL-6 level. (D) Total cells counts. (E) Neutrophils counts. #p < 0.05, ##p < 0.01, ###p < 0.001 indicated the indices of corresponding groups compared with anti-ICAM/SV/NLCs treatment group after 24-h administration. *p < 0.05, **p < 0.01, ***p < 0.001 indicated the indices of corresponding groups compared with anti-ICAM/SV/NLCs treatment group after 48-h administration. The data represent the mean ± SD (n = 6).
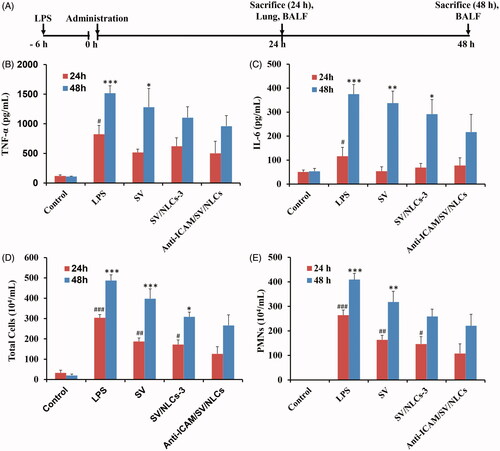
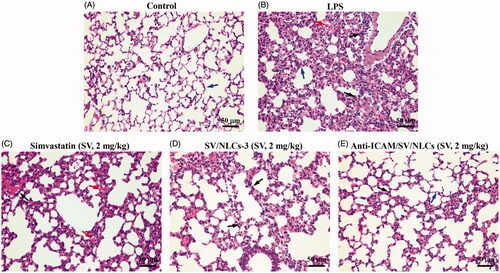
Figure 7. Histopathological examination. Lung section of (A) control mice, (B) LPS-induced model mice, (C) free simvastatin-treated mice, (D) non-targeted SV/NLCs-3-treated mice, (E) anti-ICAM/SV/NLCs-treated mice. The blue arrows indicate alveolar wall. The red arrows depict the alveolar wall hyperemia. The black arrows indicate the neutrophils infiltration (bar = 50 μm).