
Figures & data
Table 1. The Papp of puerarin and the TEER of the BBB model at 120 min associated with the action of borneol (n = 3).
Figure 1. Mean concentration-time curves of puerarin in (A) plasma and (B) brain after administration of puerarin (200 mg/kg) NCS without or with different dose of borneol (25, 50, 100 mg/kg) in mice (n = 6).
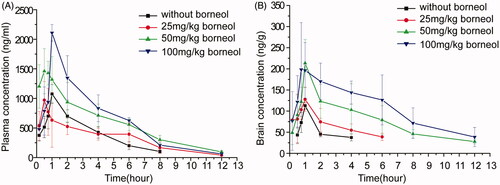
Table 2. Pharmacokinetic parameters of puerarin in mice plasma after administration of puerarin (200 mg/kg) NCS without or with different dose of borneol (25, 50, 100 mg/kg) (n = 6).
Table 3. Pharmacokinetic parameters of puerarin in mice brain after administration of puerarin (200 mg/kg) NCS without or with different dose of borneol (25, 50, 100 mg/kg) (n = 6).
Figure 2. Mean concentration-time curves of puerarin in (A) plasma and (B) brain after administration of NCS, ICS and SMEDDS containing both puerarin (200 mg/kg) and borneol (100 mg/kg) in mice (n = 6).
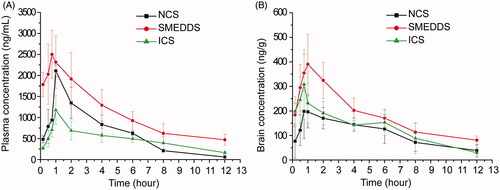
Table 4. Pharmacokinetic parameters of puerarin in mice plasma after administration of NCS, ICS and SMEDDS containing both puerarin (200 mg/kg) and borneol (100 mg/kg) (n = 6).
Table 5. Pharmacokinetic parameters of puerarin in mice brain after administration of NCS, ICS and SMEDDS containing both of puerarin (200 mg/kg) and borneol (100 mg/kg) (n = 6).
Supplemental material