Figures & data
Figure 1. The content of mitochondrial ATP in each group after incubating for 6 h, 12 h, and 24 h. It was measured by commercial kits. Date represented are mean ± SD of 3 separate experiments. *p < 0.05, **p < 0.01 versus the control group. ##p < 0.01 versus group Bup1000.
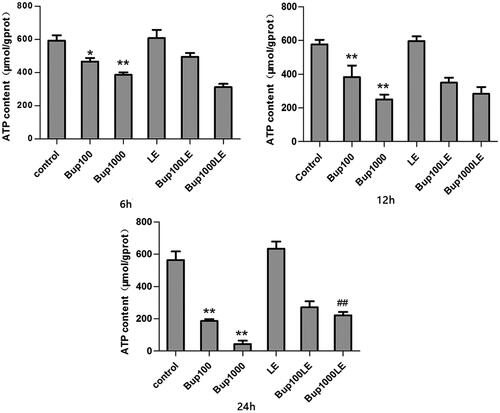
Figure 2. Mitochondrial calcium ATPase activity was measured by commercial kits after cells were incubated for 6 h, 12 h, and 24 h. Date represented are mean ± SD of 3 separate experiments. *p < 0.05, **p < 0.01 versus the control group. ##p < 0.01 versus group Bup100. ++p < 0.01 versus group Bup1000.
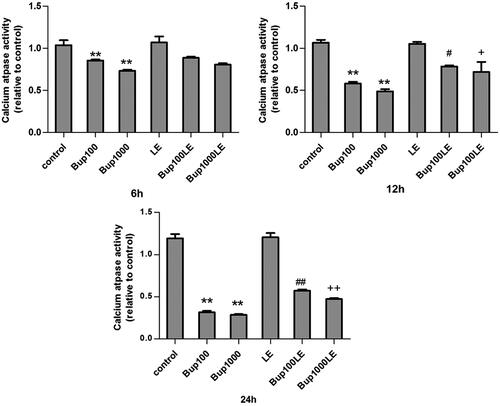
Figure 3. Mitochondrial membrane potential was measured using DiBAC4(3) and detected by flow cytometry. The fluorescence was blue-green and fluorescence intensity was detected after cells were incubated for 6 h, 12 h, and 24 h. Date represented are mean ± SD of 3 separate experiments. *p < 0.05, **p < 0.01 versus the control group. ##p < 0.01 versus group Bup100. ++p < 0.01 versus group Bup1000.
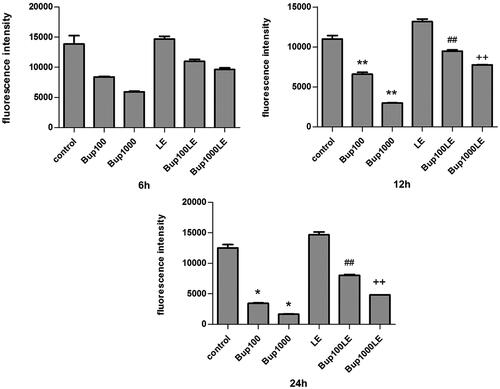
Figure 4. Mitochondrial calcium ion detection was detected by flow cytometry using Fluo-3 AM. The concentration of calcium ion was detected after cells were incubated for 6 h, 12 h, and 24 h. Date represented are mean ± SD of 3 separate experiments. *p < 0.05, **p < 0.01 versus the control group. ##p < 0.01 versus group Bup100. ++p < 0.01 versus group Bup1000.
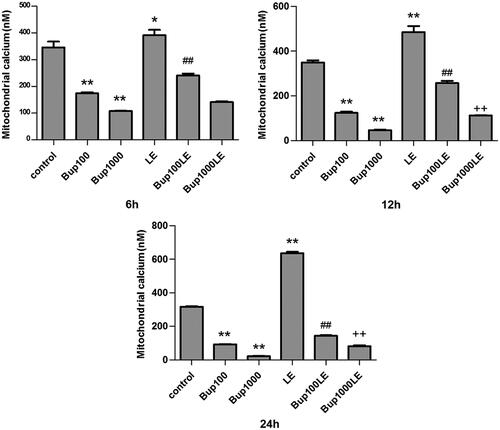
Figure 5. (A) Cell viability was detected by CCK8 assay after cells were incubated for 24 h. (B and C) Cell apoptosis was detected by flow cytometry using the Annexin V-FITC/PI double-labeling method. Date represented are mean ± SD of 3 separate experiments. **p < 0.01 versus the control group. ++p < 0.01 versus group Bup1000.
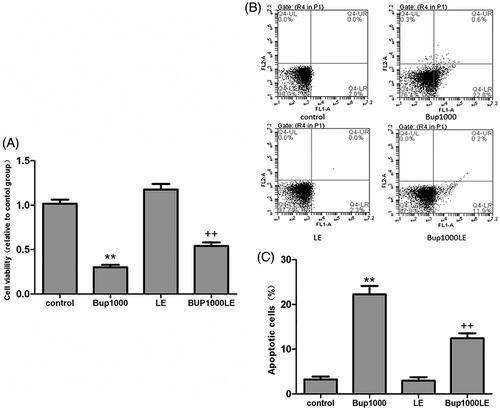
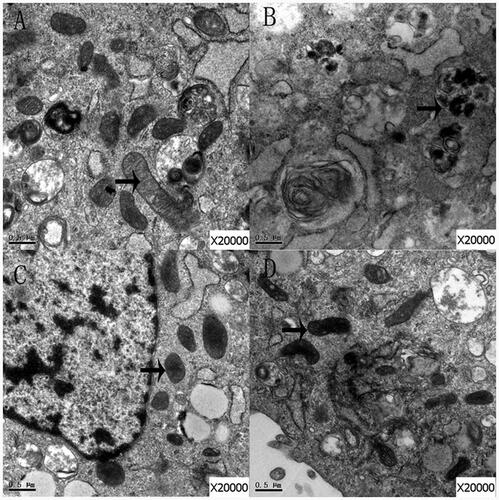
Figure 6. The mitochondria of cells in group control (A), group Bup1000 (B), group LE (C) and group Bup1000LE (D) were scanned by electron microscope. The arrow is mitochondria.