Figures & data
Figure 1. (A) Encapsulation efficiency (EE%) and drug loading (DL%) of nanoparticles based on various amount of NUC adding (mean ± SD, n = 3). FTIR spectra (B) and DSC curves (C) of NUC, PLGA and NUC-PLGA-NPs. Size distribution (D) and zeta potential (E) of PLGA. Size distribution and a representative TEM image (F) and zeta potential (G) of NUC-PLGA-NPs. (H) In vitro release of NUC from NUC-PLGA-NPs in simulating gastric fluid at pH 1.2 and in simulating intestinal fluid at pH 6.8 over a period of one week (mean ± SD, n = 3).
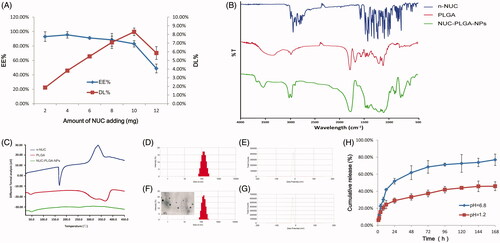
Figure 2. Cellular uptake of free coumarin-6 (A) and coumarin-6-loaded NPs (B) against HepG2. Scale bar: 50 μm.
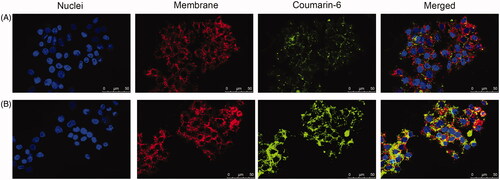
Figure 3. Cell viability (A) (mean ± SD, n = 3) and apoptosis (B) of HepG2 cells treated various formulations. (C) The effect of NUC on TG accumulated HepG2 of OA-induced hepatic steatosis. (D) Relative integrated option density (IOD) value was quantitated using Image Pro Plus 6.0 (mean ± SD, n = 3). *p < 0.05.
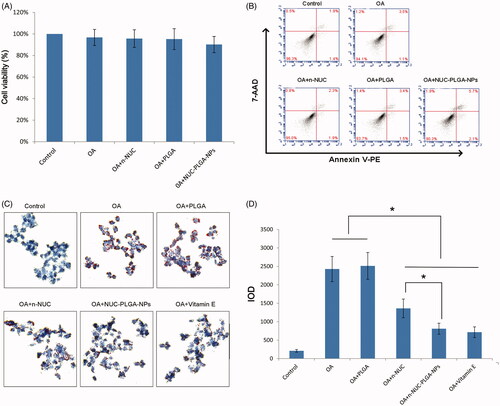
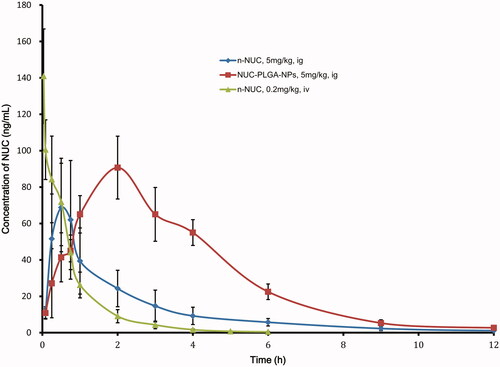
Figure 4. Mean plasma concentration–time curves of NUC (mean ± SD, n = 6).