Figures & data
Figure 1. The picture of sub-tenon embedded tubes in rabbit: (a) the tube sutured on sclera, (b) Sutured on the conjunctive edge, and (c) The tube sutured in the eyelid.
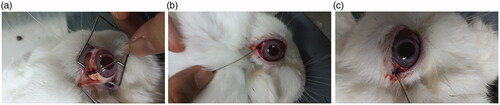
Figure 2. The mean levels of dexamethasone concentrations in the posterior segment tissue at different times in vitreous (a), choroid/retina compound (b), and sclera (c).
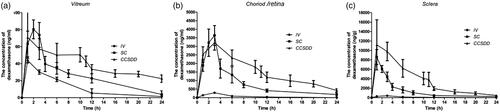
Table 1. The dexamethasone concentrations in the posterior segment tissue following CCSDD, IV, SC.
Figure 3. Levels of dexamethasone concentration in vitreous (a), choroid/retina compound (b), sclera (c). (*denotes that compared with CCSDD group, the difference was statistically significant).
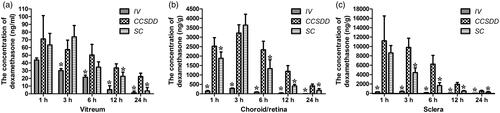
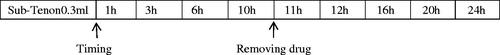
Chart 1. The illustration of the time in CCSDD group.