Figures & data
Figure 1. Size distribution of GC-FUA-NPs (A), and release profile of the GC-FUA-NPs and 5-Fu loaded GC nanoparticles in PBS (n = 3, B), and transmission electron microscope (TEM) image of GC-FUA nanoparticles (C).
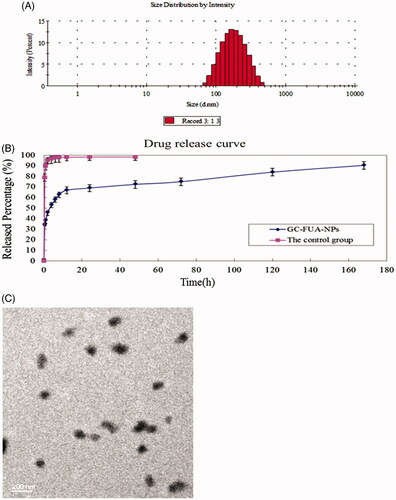
Figure 2. BSA adsorbance incubated with GC-FUA-NPs and free 5-Fu at different times (A), and percentage of red blood cell hemolysis incubated with GC-FUA-NPs (B).
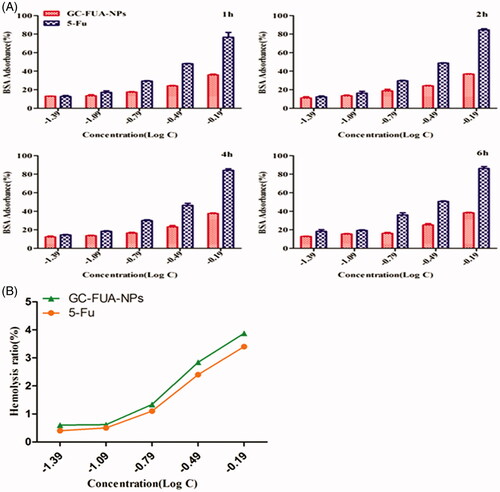
Figure 3. In vitro cell inhibition of 5-Fu and GC-FUA-NPs in HepG2 at different times (A) 24 h and (B) 48 h, and in A549 at different times (C) 24 h and (D) 48 h (n = 3, p > 0.05 versus 5-Fu).
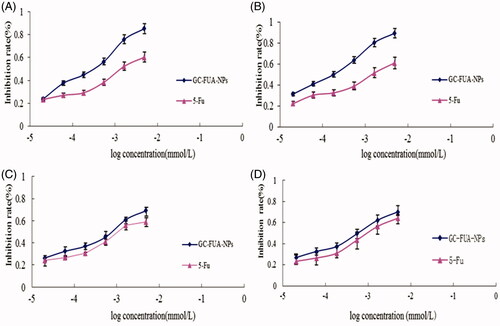
Table 1. IC50 of 5-Fu and GC-FUA-NPs in HepG2 and A549 cells (A), and pharmacokinetic parameters of 5-Fu and GC-FUA-NPs administration to SD rats (n = 3, B).
Figure 4. In vitro cell uptake of the FUA and GC-FUA-NPs against (n = 3, A), and galactose incubation cells uptake of the FUA and GC-FUA-NPs by HepG2 and A549 cells (n = 3, B).
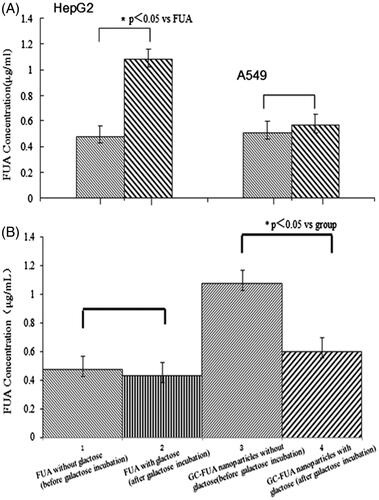
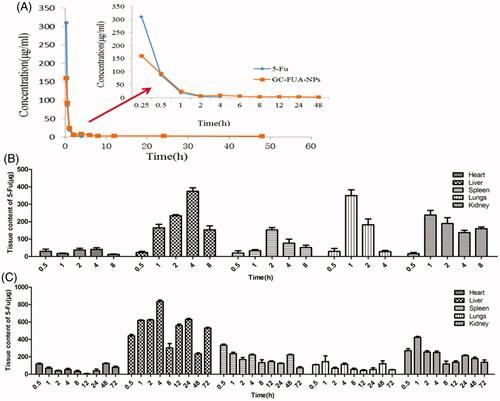
Figure 5. Mean 5-Fu concentration–time curves in plasma after tail vein i.v. injection of free 5-Fu and GC-FUA-NPs to SD rats (n = 3, A), and biodistribution of free 5-Fu (B) and GC-FUA-NPs (C) in tissue (n = 3).