Figures & data
Figure 1. The schematic depiction, cell distribution, uptake and gene silencing efficiency of cRGD-siEGFR in vitro. (A) A diagram of cRGD-siEGFR conjugates. The cRGD moiety is conjugated to the 5′-phosphate of the passenger (sense) strand of EGFR siRNA through a thiol-maleimide linker. The backbone of EGFR-siRNA was modified with three 2′-O-Me on both ends of the sense strand and antisense strand. (B) Confocal laser scanning microscopy images of the intracellular distribution of cRGD-siEGFR. U87MG cells were transfected with Lipo2000/siRNA-Cy5, cRGD-siEGFR-Cy5, naked EGFR siRNA-Cy5, and for additional specificity tests, before being transfected with cRGD-siEGFR-Cy5, cells were pre-treated with 1 μM un-conjugated cRGD peptide (cRGD blocked). Cell nuclei were counterstained with DAPI (blue) and siRNA was labeled with Cy5 (red; marked by arrow). After 6 h of transfection, cells were fixed and visualized using confocal laser microscopy. (C) Cellular uptake levels of cRGD-siEGFR-Cy5 and siRNA-Cy5 in U87MG cells after 6 h of incubation with different ratios of cRGD-siEGFR-Cy5 and siRNA-Cy5, as measured by flow cytometry. Red area: fluorescence intensity related to cellular uptake of siRNA-Cy5. (D and E) Quantitative analysis of Cy5-positive expression levels and fluorescence intensity, *p < 0.05, compared with the siRNA-Cy5 group, n = 3. (F) Specific gene silencing in vitro for cRGD-siEGFR. U87MG cells were treated for 48 h with different concentrations of cRGD-siEGFR. (G and H) Quantitative analysis of EGFR protein expression levels. The expression of EGFR protein was calculated relative to the expression of GAPDH protein. *p < 0.05 vs. control group, #p < 0.05 vs. cRGD-siNC group, n = 3; bar = 20 μm or 5 μm.
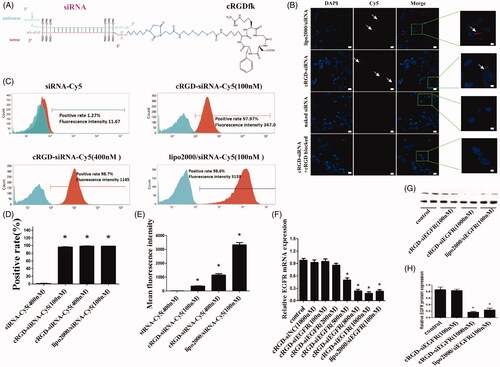
Figure 2. Cell proliferation and apoptosis in vitro. (A) Cell proliferation was detected with CCK-8. U87MG cells were incubated with different dosages of cRGD-siEGFR (400, 600 or 800 nM) and tested at 48 h or 72 h by a CCK-8 assay. Control was the untreated group. cRGD-siNC (800 nM) was the negative control group. (B) The proliferation of U87MG cells was detected by EDU after treatment with cRGD-siEGFR (800 nM) for 48 h. Control was the untreated group. cRGD-siNC (800 nM) was the negative control group. Treatment with siRNA (100 nM) using a transfection reagent (Lipo2000) was used as a knockdown positive control. A fluorescence image of cellular DNA (Hoechst stain; blue), and a fluorescence image of EdU-labeled DNA revealed by reaction with Alexa568 azide (red; marked by arrow). (C) Quantitative analysis of U87MG cell proliferation. The proliferative activity was relative to the fluorescence image of EdU-labeled DNA (red fluorescence; marked by arrow). (D) The apoptosis of U87MG cells was detected by flow cytometry after different treatments for 3 days. (E) Quantitative analysis of U87MG cell apoptosis. *p < 0.05 vs. Control group, #p < 0.05 vs. cRGD-siNC group, n = 3; bar = 20 μm.
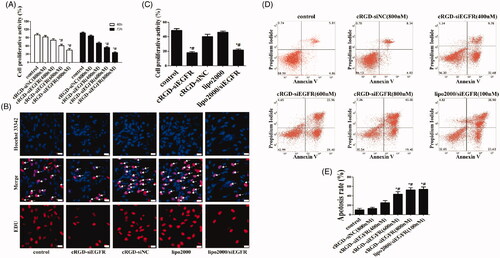
Figure 3. In vivo distribution and tumor vascular permeability of cRGD-siEGFR. (A) cRGD-siEGFR and un-conjugated siRNA bio-distributes to tumors. Nude mice bearing a U87MG tumor xenograft were injected with Cy5-labeled cRGD-siRNA conjugates or un-conjugated 2′-O-Me-stabilized siRNAs (tail vein, single dose, 1 nmol/20 g), and fluorescence images of whole animals or isolated organs were taken at indicated time points, 72 h after injection, using an IVIS imaging system. All images were scaled to the same minimum and maximum color values. (B) Tumor tissue targeting of cRGD-siRNA. Nude mice (female, 4–6 weeks, ∼20 g) were inoculated subcutaneously on the right back with 5 × 10⁶ U87MG or HeLa cells. When tumor volume reached 120 mm3, the animals were randomized into different groups for treatment testing. Mice bearing U87MG tumors were injected with either cRGD-siEGFR-Cy5 (1 nmol/20 g) or EGFR siRNA-Cy5 (1 nmol/20 g). Mice bearing HeLa tumors were injected with cRGD-siEGFR-Cy5 (1 nmol/20 g). Animals were euthanized 24 h after treatment. Tumor tissue was stained with DAPI (blue-fluorescence), blood vessels were marked with CD31 (green-fluorescence; marked by left arrow), and siRNA was labeled with Cy5 (red fluorescence; marked by right arrow); bar = 200 μm.
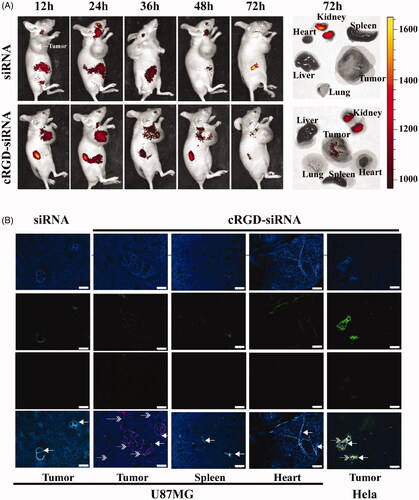
Figure 4. Anti-tumor activity of cRGD-siEGFR in vivo. (A) The tumor growth curve. Nude mice were repeatedly administered treatments (7 times) via intravenous injection in the tail, over an interval of 2 days. The tumor volume was measured before each injection. The growth curves were plotted as the mean tumor volume ± SD (standard deviation). (B) The cumulative growth of tumor volume. The cumulative growth volume is equal to the volume of a tumor three days after the last injection minus the volume of the tumor before injection. (C) Tumor weight. The mice were euthanized three days after the last injection, and the tumor was excised, weighed and photographed (D). (E) Apoptosis in tumor tissue was detected by TUNEL staining. The apoptotic cells were brown under a light microscope; bar = 100 μm or 20 μm.
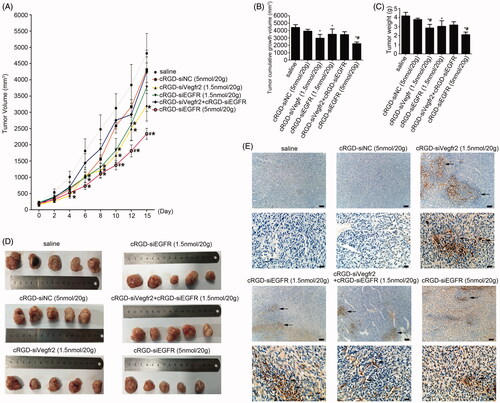
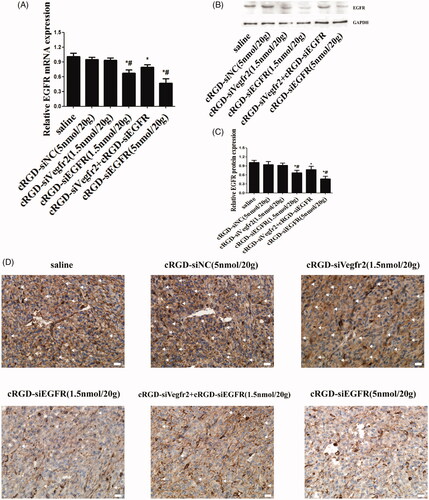
Figure 5. Gene silencing of cRGD-siEGFR in vivo. (A) qRT-PCR analysis of the EGFR mRNA levels expressed in tumors. EGFR mRNA expression was normalized to GAPDH mRNA. (B) Western blot analysis of EGFR protein expressed in tumors. (C) Quantitative analysis of EGFR protein expression levels. The expression of EGFR protein was calculated relative to the expression of GAPDH protein. (D) The relative expression level of EGFR protein in tumor tissue was detected by immunohistochemical staining. Anti-EGFR antibody (ab52894) is shown as brown (marked by arrow). *p < 0.05 vs. control group, #p < 0.05 vs. cRGD-siNC group, n = 3; bar = 20 μm.