Figures & data
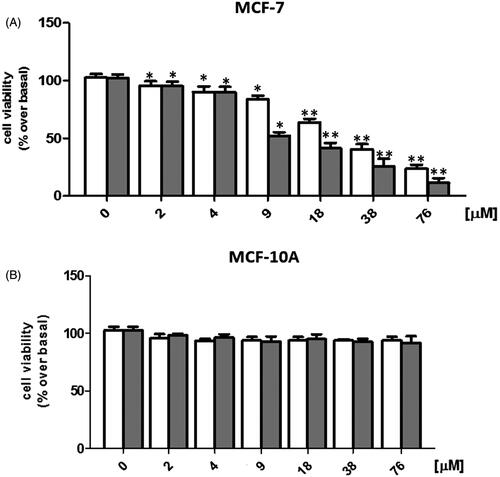
Figure 1. FT-IR spectra of (A) sunitinib malate, (B) sericin–sunitinib conjugate and (C) sericin.
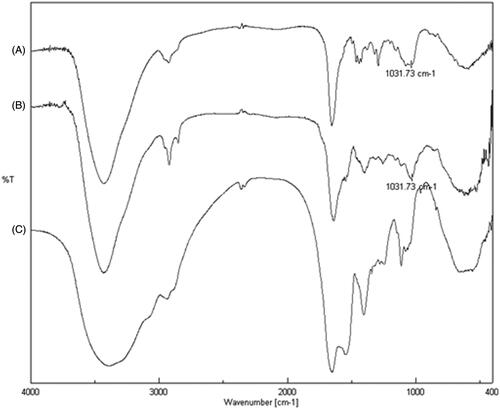
Figure 2. SDS-PAGE of SER and SER–SUT conjugate. 0.02 μg of proteins were separated by SDS-PAGE and stained with silver nitrate. Lane 1, marker; Lane 2, SER; Lane 3, SER–SUT conjugate. Black arrows indicate protein bands.
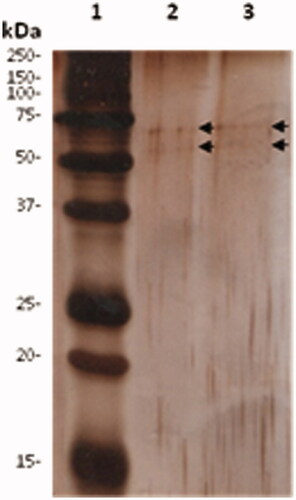
Table 1. Bioavailability of sunitinib and SER–SUT conjugate.
Figure 3. Second derivative spectra of SUT (A) and SER–SUT conjugate (B) calculated from the absorption spectra, at different concentration of SUVs (1) 0 μM, (2) 150 μM, (3) 300 μM, (4) 450 μM, (5) 600 μM, (6) 750 μM, (7) 900 μM, (8) 1050 μM, (9) 1200 μM. Black arrows indicate the second derivative absorption spectra of SUVs in absence of SUT or SER–SUT.
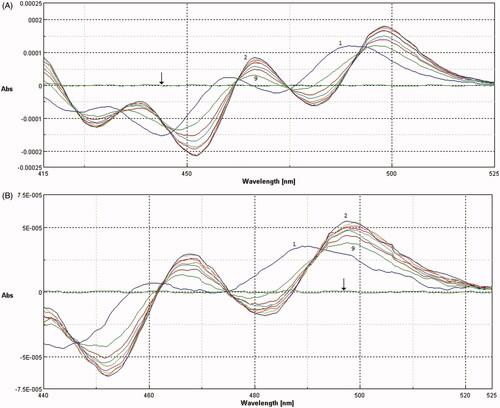
Table 2. Log(Kp) and IC50 values of sunitinib and SER–SUT conjugate.
Figure 4. Graphs of MCF-7 (A) and MCF-10A (B) cell viability, exposed to □Sunitinib; ▪sericin–sunitinib conjugate. *p < 0.05; **p < 0.01.