Figures & data
Table 1. Pharmaceutical characteristics of nR-NLC.
Figure 1. In vitro drug release of PTX-loaded nR-NLC.
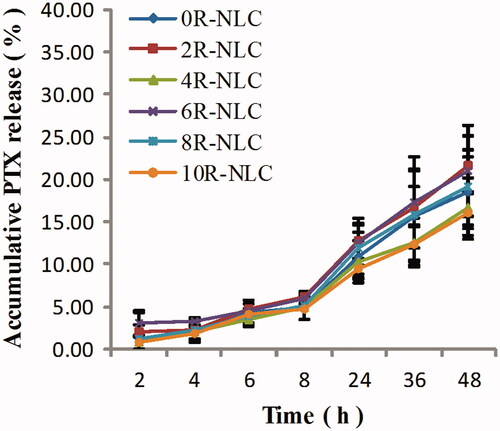
Figure 2. Cellular uptake of nR-NLC by clearage method. (A) The cellular uptake of Cou 6-loaded nR-NLC by A549 cells at different incubation time at 37 °C, the Cou 6 concentration was at 2 μg/ml. (B) The cellular uptake of Cou6-loaded nR-NLC at 37 °Cand 4 °C at 4 h, the Cou6 concentration was at 2 μg/ml. Results are presented as mean ± SD (n = 3). Significant differences from 0R-NLC are indicated as follows: *p < 0.05, **p < 0.01 and ***p < 0.001.
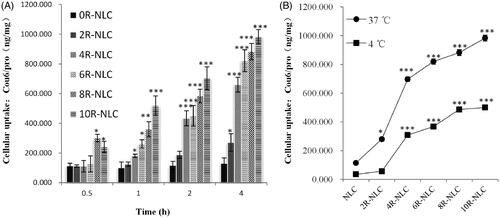
Figure 3. Cellular uptake of Cou 6-loaded nR-NLC in A549 cells at different incubation time. The Cou 6 concentration was 2 μg/ml. The pictures were taken by CLSM (TCS SP5 II, Leica; LSM710, CarlZeiss). The cell nuclei was stained by DAPI.
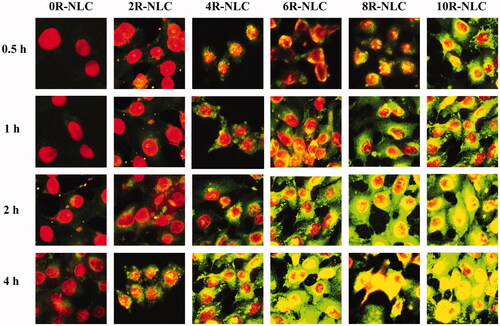
Figure 4. In vitro cytotoxicity of nR-NLC in A549 cells at 24 h. (A) The cytotixicity of PTX-loaded nR-NLC at various PTX concentration; (B) The cytotoxicity of blank nR – NLC, the concentration was in accordance with (a). Results are presented as mean ± SD (n = 6). The legend is identical in the pictures.
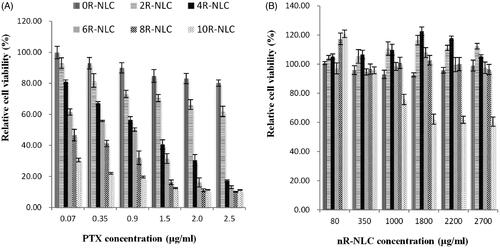
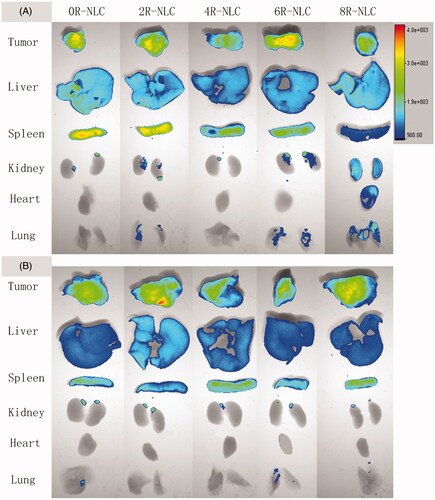
Figure 5. Tissue distribution of Dir-loaded nR-NLC in S180 tumor-bearing mice. The Dir concentration was 2.5 mg/kg. The organs were collected after the sacrifice of the mice, and the pictures were taken by the In Vivo FX PRO imaging system (Bruker, Germany) with the same exposure time, the minimum and maximum fluorescent intensity was 900 and 4000, respectively, in all the groups.