Figures & data
Table 1. The TBA volume and lecithin concentration in each formulation and the detected particle size and PdI of the obtained original lipid vesicles.
Table 2. Results of estimated marginal means of the particle size and PdI.
Figure 1. Effect of stirring rate on the vesicle size (A) and PdI (B) of original lipid vesicles. Data represent mean (± SD) of three preparations, *p < 0.05 with each group.
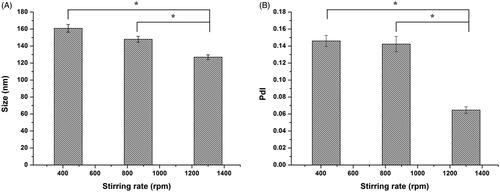
Figure 2. TEM micrographs of the samples: (A) Original lipid vesicles; (B) ARM-NPs; (C) reconstructed liposomes.
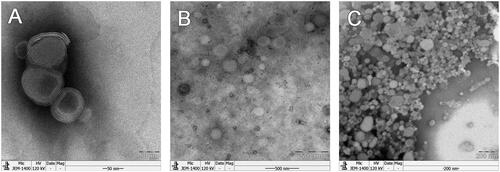
Table 3. The particle size and PdI of original lipid vesicles, ARM-NPs and reconstructed liposomes.
Figure 3. FT-IR and CD results. (A) Comparison of FT-IR spectra: lyophilized complexes, pure sCT, atomized sCT from pMDIs and freeze-dried free sCT; (B) Fitting curves of sCT amide I band of pure sCT; (C) Fitting curves of sCT amide I band of freeze-dried free sCT; (D) Fitting curves of sCT amide I band of atomized sCT from pMDIs; (E) Comparison of sCT CD spectra under different conditions: aqueous solutions of SCT with SDS, pure sCT, atomized sCT from pMDIs and the lyophilized complexes.
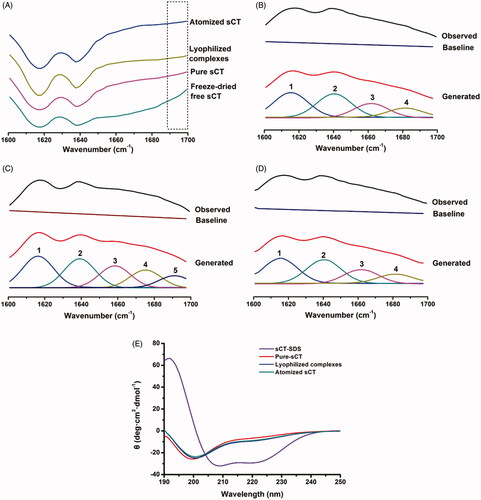
Figure 4. Results of formulation characterization and stability evaluation. (A) The aerosolization properties of the optimized sCT-containing ARM-NPs for pMDIs formulation. Data represent mean (± SD) of three preparations; (B) The aerosolization properties of the optimized sCT-containing ARM-NPs for pMDIs formulation 12-week during storage under 4–6 °C condition. Data represent mean (± SD) of three preparations; (C) Content of drug per press during 12-week storage under 4–6 °C condition. Data represent mean (± SD) of three preparations.
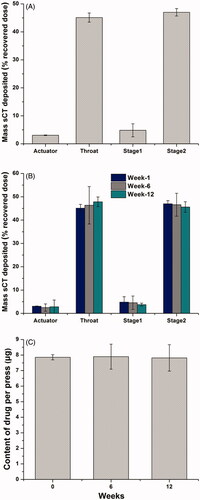
Table 4. Characterization of particle size and PdI of sCT containing pMDIs during 10-day storage under different conditions: 4, 20 and 30 °C.
Figure 5. DSC thermograms of TBA/water 1:4, TBA/water 1:4 + lecithin, lipid vesicle suspension, TBA/water 3:2 and TBA/water 3:2 + lecithin.
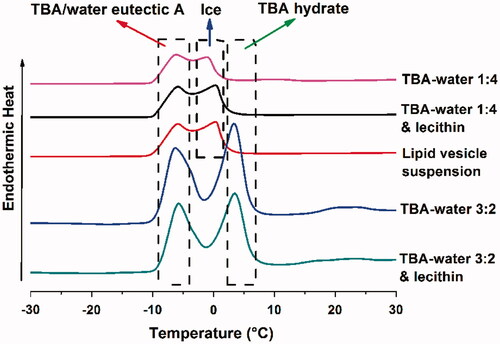
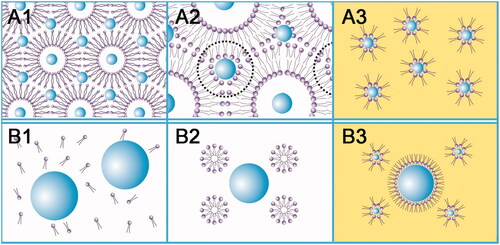
Table 5. The four kinds of frozen crystallization behavior of TBA/water system.
Figure 6. The schematic diagram about the forming process of ARM-NPs. (A) The TBA/water 1:4 system; (B) the TBA/water 3:2 system; (1) before freeze-drying; (2) during freeze-drying; (3) after adding ethanol absolute. Larger balls without tails and smaller balls with tails represented sCT and lecithin, respectively. A1, A2, B1 and B2 referred to aqueous environment while A3 and B3 depicted the addition of ethanol absolute.