Figures & data
Figure 1. Tissue distribution of PLGA nanoparticles after oral administration in mice. (A) Experimental protocol. C57BL/6J mice were treated orally with ICG or Nano-ICG. Alive mice were non-invasively imaged by FMT at 1.5 h, 3 h, 1, 2, 3 and 4 day after treatment. Tissue distribution of ICG (B) and Nano-ICG (C) were evaluated for 4 days after oral administration. The color scale bar is represented in arbitrary unit from blue (low intensity of fluorescence signal) to red (high intensity of fluorescence signal).
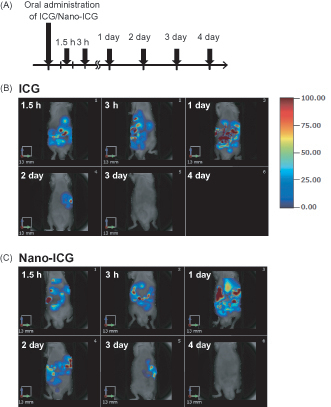
Figure 2. Effects of Nano-Orz on body weight and blood glucose level in ob/ob mice. Effects of regular γ-oryzanol (320 μg/g body weight/day) (A) and Nano-Orz (0.01 and 0.1 μg/g body weight/day) (B) on body weight in ob/ob mice. Effects of regular γ-oryzanol (C) and Nano-Orz (D) on blood glucose levels in ob/ob mice in the fed state. (E) Effects of Nano-Orz (0.01 and 0.1 μg/g body weight/day) on plasma insulin levels. Data are expressed as mean ± SEM (n = 8). *p < 0.05, **p < 0.01 compared with control mice. ANOVA followed by multiple comparison tests (Bonferroni/Dunn method) was used.
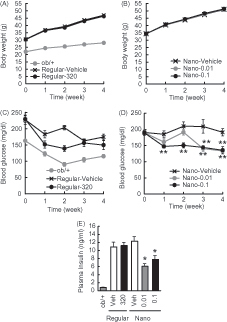
Figure 3. Effects of Nano-Orz on glucose homeostasis in ob/ob mice. Blood glucose levels and AUC during GTT in mice treated with regular γ-oryzanol (A) and Nano-Orz (B) for 2 weeks. Data are expressed as mean ± SEM (n = 8). †† p < 0.01 compared with ob/+ mice. *p < 0.05, **p < 0.01 compared with Nano-Vehicle-treated mice. ANOVA and repeated-measures ANOVA followed by multiple comparison tests (Bonferroni/Dunn method) were used. (C) Levels of mRNA in the hypothalamus are shown for Chop, ERdj4 and Xbp1s. The mRNA levels were determined using real-time PCR. Values were normalized to that of 18S rRNA. (D) IHC analyses of isolated pancreatic islets. Serial paraffin-embedded sections were stained with anti-insulin, anti-glucagon and anti-cleaved caspase-3 antibodies. Scale bar, 20 μm; magnification, ×400. (E–H) Mean islet size (E) and the ratios of insulin-positive area (F), glucagon-positive area (G) and cleaved caspase-3-positive area (H) to the total islet area were calculated (n = 3; 156–203 islets), respectively. Data are expressed as mean ± SEM. *p < 0.05, **p < 0.01, versus control mice. ANOVA followed by multiple comparison tests (Bonferroni/Dunn method) was used. Student’s t-test was used to analyze the differences between two groups.
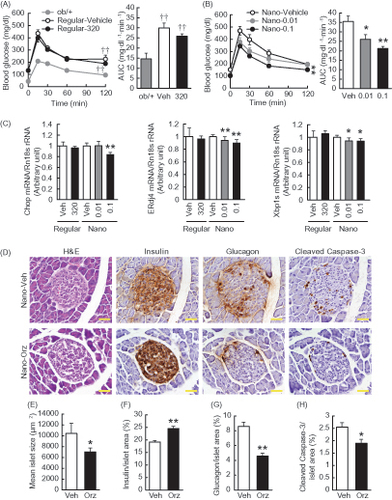
Figure 4. Effects of Nano-Orz on insulin tolerance and hepatic gene expressions related to ER stress and glucose homeostasis in ob/ob mice. Blood glucose levels and the AUC during ITT treated with regular γ-oryzanol (A) and Nano-Orz (B) for 3 weeks. Data are expressed as mean ± SEM (n = 8). †† p < 0.01 compared with ob/+ mice. *p < 0.05, **p < 0.01 compared with Nano-Vehicle-treated mice mice. (C, D) Expression levels of mRNA for Chop, ERdj4, Xbp1s (C), PGC1α, Pepck and G6Pase (D) in liver (n = 8). The mRNA levels were determined by real-time PCR and normalized by those of 18S rRNA. Data are expressed as mean ± SEM. *p < 0.05, **p < 0.01 versus vehicle-treated mice (Veh). ANOVA and repeated-measures ANOVA followed by multiple comparison tests (Bonferroni/Dunn method) were used.
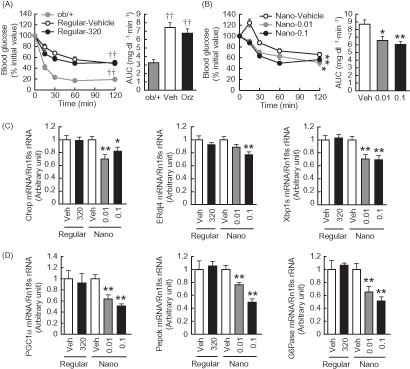
Figure 5. Effects of Nano-Orz on lipid metabolism in ob/ob mice. Metabolism of triglyceride (TG) (A–E) and total cholesterol (F–I) in Nano-Orz-treated ob/ob mice. Plasma (A, F), hepatic accumulation (B, G) and fecal (C, H) levels of TG (A–C) and total cholesterol (F–H). (D) Oil red O staining of liver sections. Scale bar, 200 μm; magnification, ×200. (E) Expression levels of lipogenic genes, ACC1, FAS, SREBP1c and PPARα in liver (n = 8). (I) Expression levels of genes involved in cholesterol synthesis, SREPB2, LDLR, HMGcs and HMGcr in liver (n = 8). The mRNA levels were determined by real-time PCR and normalized by those of 18S rRNA. Data are expressed as mean ± SEM. *p < 0.05, **p < 0.01 versus vehicle-treated mice (Veh). ANOVA followed by multiple comparison tests (Bonferroni/Dunn method) was used.
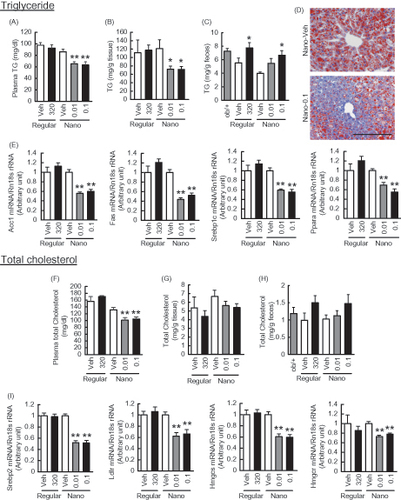
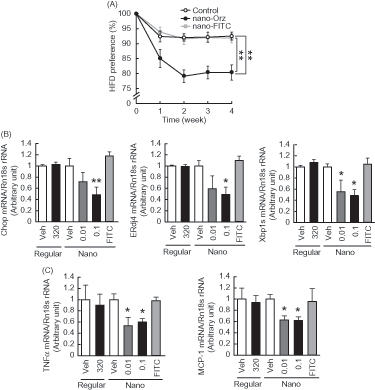
Figure 6. Impact of Nano-Orz on preference for dietary fat and hypothalamic ER stress in ob/ob mice. (A) HFD preference in mice treated with Nano-Orz. Mice were allowed free access to CD and HFD (n = 4; three mice per cage). Mice were treated with Nano-Orz (0.01 and 0.1 μg/g body weight/day) or FITC-encapsulated PLGA nanoparticles (0.1 μg/g body weight/day) for 4 weeks, and mRNA levels were measured in the hypothalamus for Chop, ERdj4, Xbp1s (B), TNFα and MCP-1 (C). Values were normalized to that of 18S rRNA and are expressed as levels relative to that of vehicle-treated mice (n = 8). The mRNA levels were determined using real-time PCR. *p < 0.05, **p < 0.01 compared with vehicle-treated mice. ANOVA followed by multiple comparison tests (Bonferroni/Dunn method) was used.