Figures & data
Figure 1. Characterization of AuNPs. Panel A. Transmission electron micrograph of uncoated 5 nm particles. The average primary size was 5 ± 2 nm (mean ± SD) based upon measurement of 100 particles. Panel B. Particle size distribution of 5 nm AuNPs. Particle size distributions for 1 kDa, 2 kDa and 5 kDa PEG-coated particles. The average hydrodynamic radiuses were 12 ± 2, 16 ± 2 and 22 ± 4, respectively (mean ± SD).
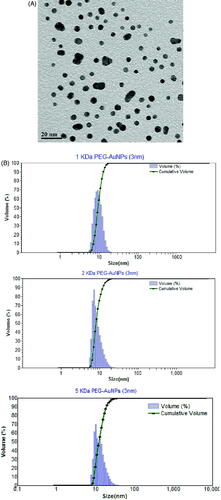
Figure 2. Blood concentration versus time profile following intravenous administration of 1, 2 or 5 kDa PEG-coated 5 nm AuNPs. Rats were administered a single intravenous dose (0.8 mg/kg) of 1, 2 or 5 kDa PEG coated 5 nm AuNPs. Blood samples were taken over time for up to 24 h and AuNP concentrations in blood were measured. Results are plotted beginning with the first sample after the dose (0.1 h) and are expressed as mean ± SD (N = 3).
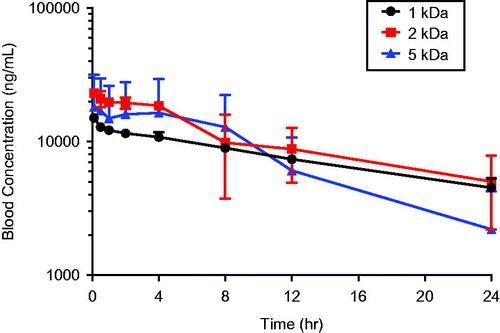
Table 1. Pharmacokinetic parameters following intravenous and oral administration of 1, 2 and 5 kDa PEG-coated gold nanoparticles.
Figure 3. Blood concentration versus time profile following oral administration of uncoated or 1, 2 or 5 kDa PEG-coated 5 nm AuNPs. Rats were administered a single oral dose (8.0 mg/kg) of 1, 2 or 5 kDa PEG coated 5 nm AuNPs by gavage. Blood samples were taken over time for up to 48 hours and AuNP concentrations in blood were measured. Results are plotted beginning with 0 h (just prior to the dose) and are expressed as mean ± SD (N = 5).
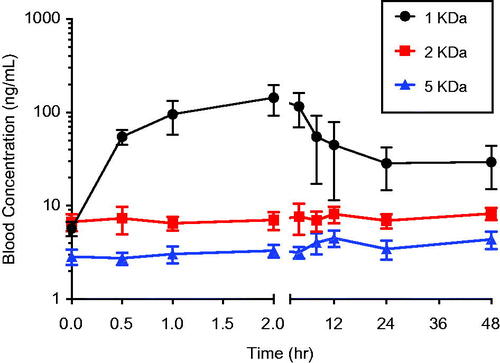
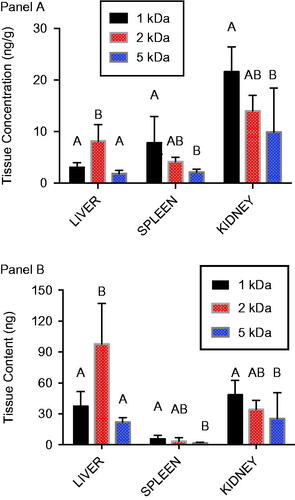
Figure 4. Tissue distribution of 1, 2 and 5 kDa PEG-coated 5 nm AuNPs following intravenous administration. Gold content was measured in liver, spleen, and kidney at sacrifice 24 h after an intravenous dose (0.8 mg/kg) of either 1, 2 or 5 kDa PEG-coated 5 nm AuNPs. A) Gold concentration in tissues. B) Mass of gold in the tissue based upon tissue concentration and total weight of the organ. Results are presented as mean ± SD, N = 5. Bars with letter superscripts (A or B) denote significant differences among PEG-coated particle types; bars with different letter superscripts are significantly different p < 0.05.
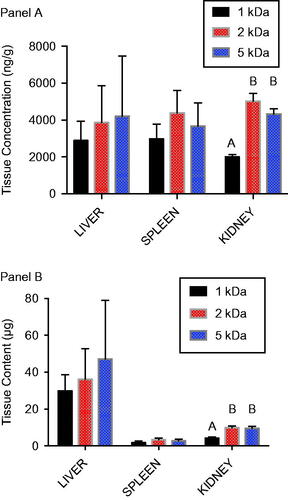
Figure 5. Tissue distribution of 1, 2 and 5 kDa PEG-coated 5 nm AuNPs following oral administration. Gold content was measured in liver, spleen, and kidney at sacrifice 48 h after an oral dose (8.0 mg/kg) of either 1, 2 or 5 kDa PEG-coated 5 nm AuNPs. A) Gold concentration in tissues. B) Mass of gold in the tissue based upon tissue concentration and total weight of the organ. Results are presented as mean ± SD, N = 5. Bars with letter superscripts (A, B or AB) denote significant differences among PEG-coated particle types; bars with different letter superscripts are significantly different p < 0.05.