
Figures & data
Figure 1. X-ray powder diffraction patterns of IVM-SDs, IVM-PMs, IVM, and HCO. IVM-SD, ivermectin-loaded solid dispersion; IVM-PM, physical mixtures of IVM, and HCO; IVM. native ivermectin; HCO, hydrogenated castor oil, the carrier of solid dispersion.
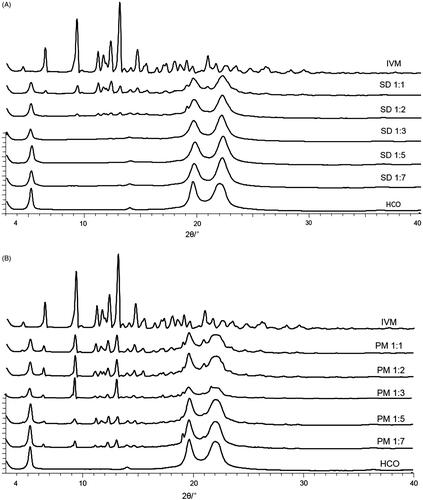
Figure 2. Fourier-transformed infrared spectroscopy spectra of IVM-SDs, IVM-PMs, IVM, and HCO. IVM-SD, ivermectin-loaded solid dispersion; IVM-PM, physical mixtures of IVM, and HCO; IVM, native ivermectin; HCO, hydrogenated castor oil, the carrier of solid dispersion.
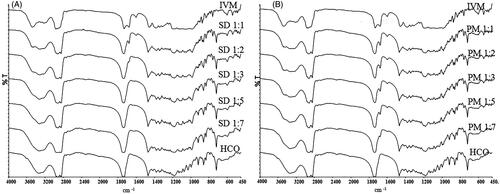
Figure 3. In vitro dissolution profile of IVM-SDs, IVM-PMs, and IVM. IVM-SD, ivermectin-loaded solid dispersion; IVM-PM, physical mixtures of IVM, and HCO; IVM, native ivermectin; HCO, hydrogenated castor oil.
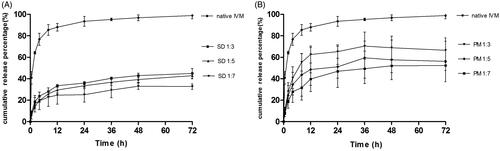
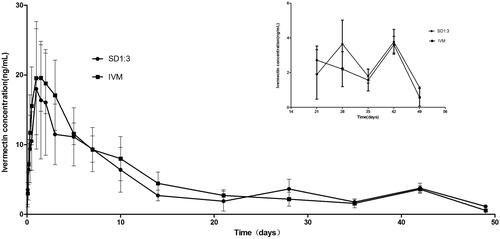
Figure 4. Plasma time–concentration profiles of IVM after subcutaneous administration of SD1:3 and IVM in rabbits. The inset figure was the plasma time–concentration profiles after 21 d. The results were expressed as mean ± SD (n = 4). SD1:3, ivermectin-loaded solid dispersion with drug:carrier weight ratios of 1:3; IVM, native ivermectin.