Figures & data
Table 1. Stability evaluation of TG-SMEDDS after been long-term saved (x±s, n = 3).
Figure 1. Dissolution profiles of crude TG in pH 1.2 (a, black square) or in pH 6.8 buffer solution (a, blank square), and TG-SMEDDS in pH 1.2 (b, black triangle) or in pH 6.8 buffer solution (b, blank triangle).
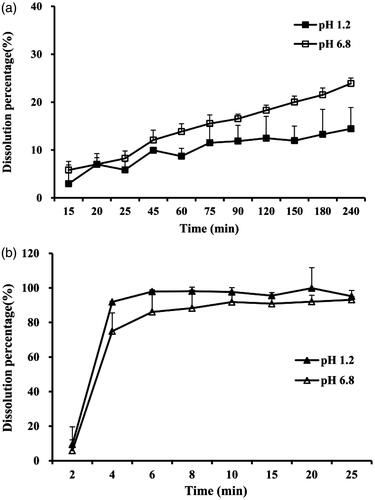
Table 2. Absorption percentage per hour of TG in gastric perfusate (%, n = 5).
Table 3. Absorption parameters of TG at intestinal segments (x±s, n = 5).
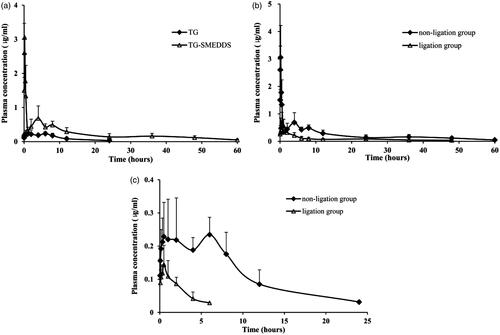
Figure 2. Mean plasma concentration–time profile of TG-SMEDDS/TG after orally administered to rats (a); mean plasma concentration-time profile of TG-SMEDDS after orally administered to non-ligation or ligation rats (b); mean plasma concentration–time profile of TG after orally administered to non-ligation or ligation rats (c).