Figures & data
Figure 1. Sol–gel–sol phase transition and thermal properties of the Dox loaded hydrogel ((A). Photograph of a sol state at 20 °C, a gel state at 37 °C and a precipitate at 50 °C; (B) DSC curve of the Dox and the Dox loaded porphyrin copolymers at a temperature range from 0 to 250 °C).
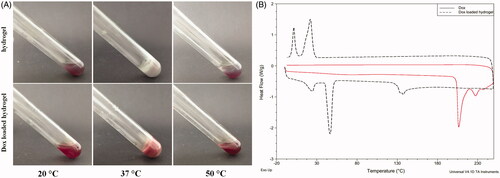
Figure 2. Drug release from hydrogel in vitro in PBS at pH of 5.5 or 7.4. The concentration of released Dox was calculated from a standard curve of known absorption of 485 nm. The results were expressed as mean ± SD (n = 3).
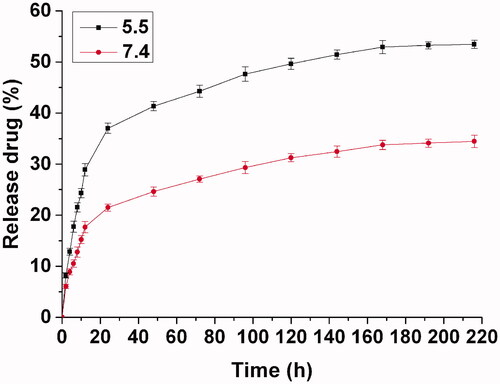
Figure 3. Multispectral fluorescence imaging of mixed fluorescence of the drug and the hydrogel with green and red ((A) Mixed fluorescence of the drug and the hydrogel in vitro; (B) Unmixed fluorescence of the hydrogel in vitro, (C) Unmixed fluorescence of the drug in vitro; (D) Mixed fluorescence of the drug and the hydrogel in vivo; (E)) Unmixed fluorescence of the hydrogel in vivo, and (F) Unmixed fluorescence of the drug in vivo).
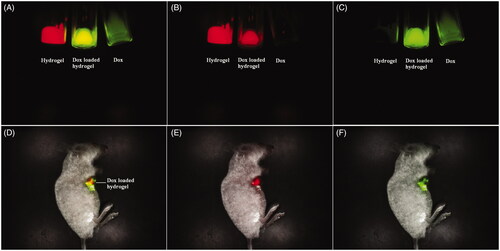
Figure 4. Fluorescence imaging tracking of drug release in vivo after direct Dox injection versus Dox loaded hydrogel injection with rainbow color, with one representative of six in each group (A). Quantative analysis of drug release, the single component of the drug was calculated quantitatively by the Maestro software.The results were expressed as mean ± SD (n =6) (B).
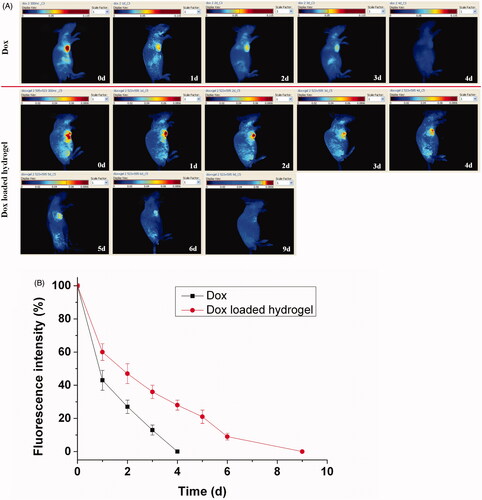
Figure 5. Hydrogel erosion from the hydrogel with rainbow color by fluorescence imaging, with one representative of six in each group. The fluorescence signals of the hydrogel were recorded with an excitation wavelength of 595 nm (A).Quantitative analysis of the hydrogel erosion by fluorescence imaging in vivo. The results were expressed as mean ± SD (n =6) (B).
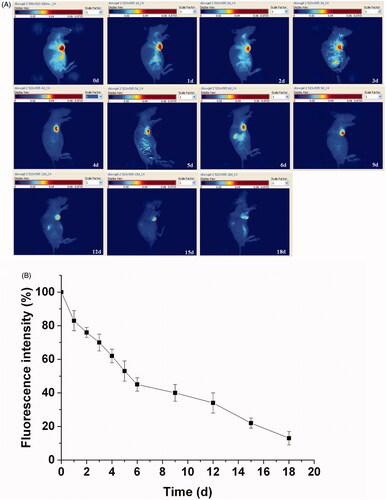
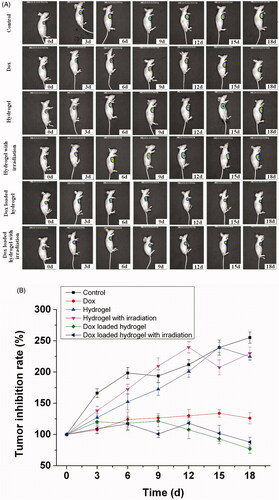
Figure 6. In vivo bioluminescence imaging for tumor therapy, with one representative of six in each group. Luciferase expressed hepatic cells Bel-7402 (1 × 10⁶) in 0.1 mL of normal saline (NS) were injected into the armpit region of Balb/c nude mice, which were divided into six different groups including control, Dox, hydrogel, hydrogel with irradiation, Dox loaded hydrogel and Dox loaded hydrogel with irradiation (A). Tumor inhibition rate of drug therapy was recorded after administration from 0 to 18 d by bioluminescence imaging. The results were expressed as mean ± SD (n = 6).