Figures & data
Figure 1. The characterization of ATNH. (A) The particles size distribution of ATNH. (B) The TEM image of ATNH. (C) The Fourier transform infrared (FTIR) spectrum of (a) PCEC-PEI, (b) FA, and (c) PCEC-PEI-FA. (D) In vitro release profile of HK from ATNH in PBS (PH = 7.4) at 37 °C.
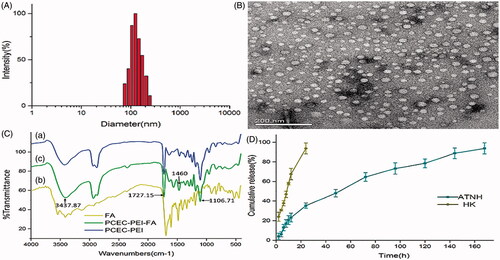
Figure 2. Cytotoxicity studies on HNE-1cells after different treatment. (A) (a) In vitro cell viability of free HK, NATNH and ATNH on HNE-1 cell after 24 h incubation; (A) (b) in vitro cell viability of BVN. *p < 0.05 and **p < 0.01, ATNH and NATNH relative to free HK. Fluorescent images of HNE-1 cells treated with medium B(a), FITC-labeled PCEC-PEI B(b), FITC-labeled PCEC-PEI-FA B(c), FITC-labeled PCEC-PEI-FA nanoparticles B(d), and FITC-labeled PCEC-PEI-FA nanoparticles + FA B(e) for 2 h.
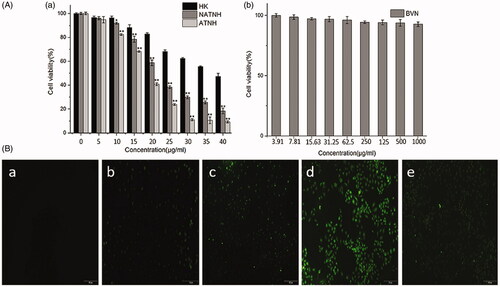
Figure 3. ATNH inhibited tumor growth in subcutaneous HNE-1 model. (A) Suppression of subcutaneous tumor growth by ATNH in mice. (B) Survival curve of mice in each group.
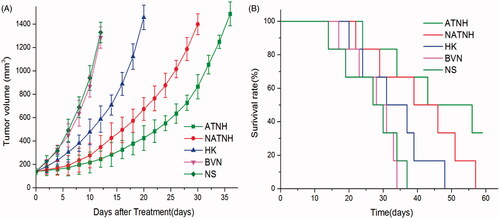
Figure 4. The representative 18F-FDG PET/CT images of the mice at the third day after the last (fourth) treatment.
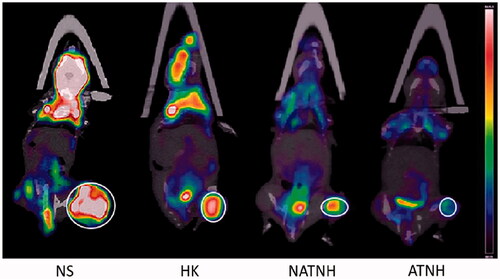
Figure 5. Cell apoptosis (A), cell-cycle phase analyze (B). Quantitative analysis of the percentage of cells in G1, S, and G2/M phase (C (a)) and the percentage of apoptosis cells (C (b)) in various groups. *p < 0.05 and **p < 0.01, ATNH, NATNH, and free HK relative to NS.
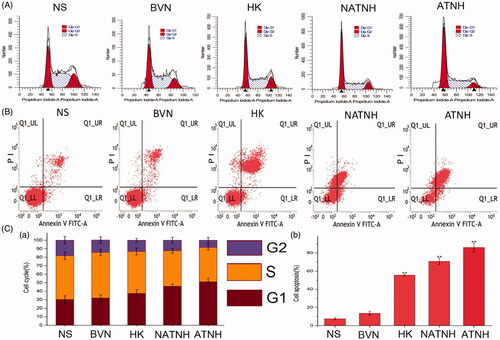
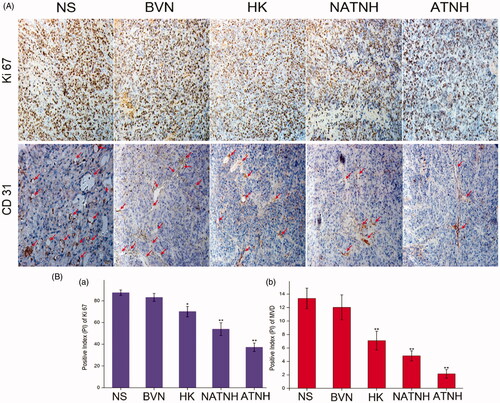
Figure 6. Immunohistochemical analysis of tumor tissue from mice that received different treatment. (A) Representative immunohistochemical images of tumor tissue from mice in various group. (B (a)) and (B (b)) represent the quantitative analysis of Ki 67 and CD 31 expression in xenografts from mice in various group, respectively. The red arrows indicate the positive expression of CD 31. *p < 0.05 and **p < 0.01, ATNH, NATNH, HK and BVN relative to NS group. Original magnification, ×200.The quantitative analysis was performed with IPP. (See color figure in the online version.)