Figures & data
Figure 1. (A) Schematic illustration of cellular uptake and drug release of CUR-SPC complex-based self-assembled NPs (CUR-SPC NPs, PEG-CUR-SPC NPs and FA-PEG-CUR-SPC NPs). (B) Schematic illustration of synthesis of CUR-SPC complex by a co-solvent method and preparation of CUR-SPC complex-based self-assembled NPs (CUR-SPC NPs, PEG-CUR-SPC NPs and FA-PEG-CUR-SPC NPs) by a self-assembly technique.
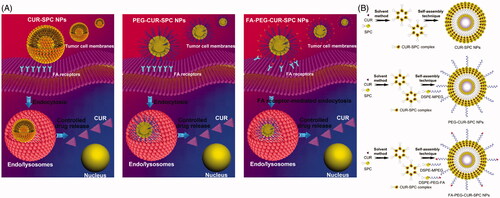
Figure 2. (A) The photographs of CUR, SPC, physical mixture of CUR and SPC and CUR-SPC complex dispersed in organic solvent (toluene) after preparation. (B) The photographs of CUR, SPC, physical mixture of CUR and SPC and CUR-SPC complex dispersed in organic solvent (toluene) after 2 h of storage. (C) TEM image of CUR-SPC complex. (D) DSC spectra, (E) XRD spectra and (F) FTIR spectra of CUR, SPC, physical mixture of CUR and SPC and CUR-SPC complex.
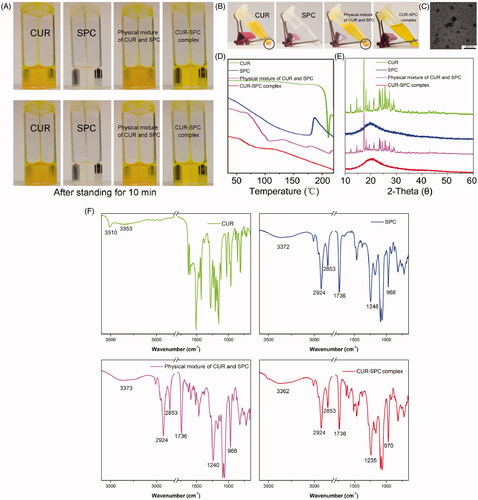
Figure 3. (A) SEM image, (B) TEM image and (C) AFM image of the self-assembled CUR-SPC NPs. (D) SEM image, (E) TEM image and (F) AFM image of the self-assembled PEG-CUR-SPC NPs. (G) SEM image, (H) TEM image and (I) confocal laser scanning microscopy image of the self-assembled FA-PEG-CUR-SPC NPs. (micro-sized FA-PEG-CUR-SPC NPs could be formulated under certain experimental parameters (low amplitude and high concentration of CUR-SPC complex). (J) Hydrodynamic particle size distribution and (K) zeta potential of CUR-SPC NPs. (L) Hydrodynamic particle size distribution and (M) zeta potential of PEG-CUR-SPC NPs. (N) Hydrodynamic particle size distribution and (O) zeta potential of FA-PEG-CUR-SPC NPs (Inset of N: photograph and Tyndall effect of FA-PEG-CUR-SPC NPs).
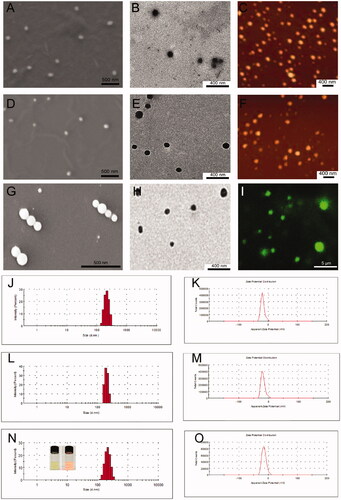
Figure 4. (A) In vitro drug release of the free CUR, CUR-SPC NPs, PEG-CUR-SPC NPs and FA-PEG-CUR-SPC NPs in PBS. Data represents mean ± SD. (n = 3). (B) In vitro pH-dependent drug release of the FA-PEG-CUR-SPC NPs in PBS. Data represents mean ± SD. (n = 3). (C) Lysosomal colocalization of the DiD-loaded CUR-SPC NPs, DiD-loaded PEG-CUR-SPC NPs and DiD-loaded FA-PEG-CUR-SPC NPs in HeLa cells after incubation for 12 h was observed by LCSM. The hydrophobic part of NPs was stained with DiD. The nuclei were stained with DAPI. The lysosomes were stained with LysoTracker red. (The scale bars were 25 μm). (D) In vitro cellular uptake of HeLa cells co-incubated with CUR-SPC NPs, PEG-CUR-SPC NPs and FA-PEG-CUR-SPC NPs examined by confocal laser scanning microscopy after 1, 2 and 4 h incubation, respectively.
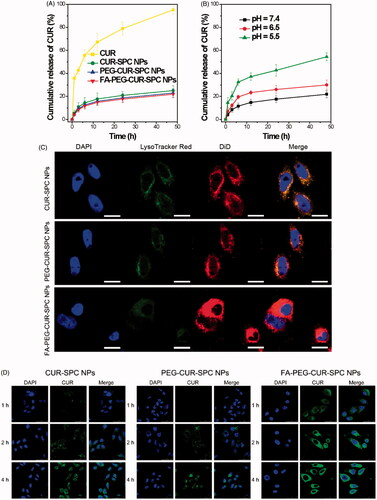
Figure 5. (A) In vitro cellular uptake of HeLa cells incubated with free CUR, CUR-SPC NPs, PEG-CUR-SPC NPs and FA-PEG-CUR-SPC NPs examined by confocal laser scanning microscopy after 4 h incubation. Blue signal, DAPI; green signal, CUR. (B) Flow cytometry histogram profiles of HeLa cells incubated with free CUR, CUR-SPC NPs, PEG-CUR-SPC NPs and FA-PEG-CUR-SPC NPs for 4 h. (C) Quantitation of mean fluorescent intensity of free CUR, CUR-SPC NPs, PEG-CUR-SPC NPs and FA-PEG-CUR-SPC NPs in HeLa cells by flow cytometry. Data were presented as mean ± SD. (n = 3, *p < 0.05). (D, E) In vitro cell viability of HeLa cells incubated with free CUR, CUR-SPC NPs, PEG-CUR-SPC NPs and FA-PEG-CUR-SPC NPs at different concentrations (0.01, 0.05, 0.1, 0.5 and 1 mg/mL) for (D) 24 and (E) 48 h. (F, G) In vitro cell viability of Caco-2 cells incubated with drug-free CUR-SPC NPs and drug-free PEG-CUR-SPC NPs at different concentrations (0.01, 0.05, 0.1, 0.5 and 1 mg/mL) for (F) 24 and (G) 48 h.
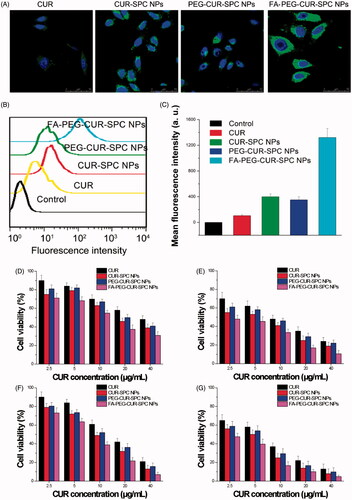
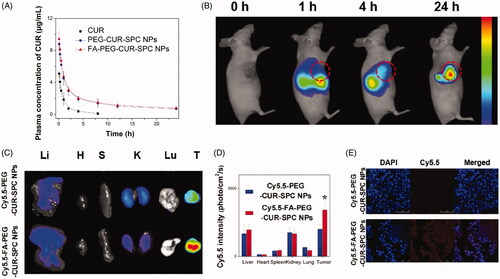
Figure 6. (A) In vivo pharmacokinetics profiles after intravenous injection of the free CUR, PEG-CUR-SPC NPs, FA-PEG-CUR-SPC NPs in rats. Data are presented as mean ± SD. (n = 3). (B) In vivo fluorescence imaging of HeLa tumor-bearing nude mice treated with Cy5.5-FA-PEG-CUR-SPC NPs by intravenous injection. Cy5.5 as a hydrophobic dye was encapsulated within the FA-PEG-CUR-SPC NPs. (C) Ex vivo fluorescence imaging and (D) quantitative analysis of normal organs and tumor excised from HeLa tumor-bearing nude mice treated with Cy5.5-PEG-CUR-SPC NPs and Cy5.5-FA-PEG-CUR-SPC NPs at the same concentration of Cy5.5. Li: liver; H: heart; S: spleen; K: kidney; Lu: lung; T: tumor. Data are presented as mean ± SD. (n = 3). (E) Frozen sections of tumors excised from mice at 24 h post intravenous injection of Cy5.5-PEG-CUR-SPC NPs and Cy5.5-FA-PEG-CUR-SPC NPs. Blue signal, DAPI. Red signal, Cy5.5.