Figures & data
Figure 1. Inhibition of cell viability following CPT or CN-CPT treatments. CAL-62 (A, B) or BHT-101 (C,D) cells (1 × 10³/well) were treated with the indicated concentrations of drug for 24–48 h. Results are expressed as % of viability inhibition of control and shown as mean ± SEM (n = 5). *p < 0.05, **p < 0.01 significantly different from the same concentration of CPT.
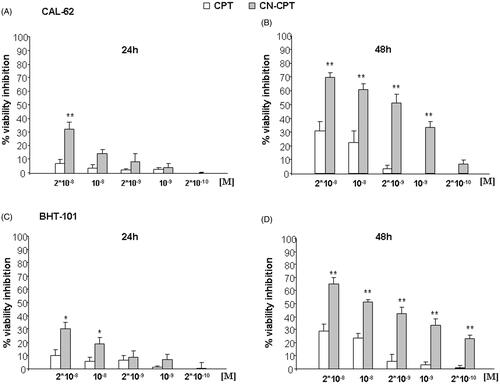
Figure 2. Induction of cell-cycle arrest by CPT or CN-CPT treatment. CAL-62 (A, B) and BHT-101 (C, D) cells (1.5 × 10⁵) were treated or not with CPT or CN-CPT (10−8 and 10−9 M) for 48 h and cell cycle was then assessed by flow cytometry. CPT and CN-CPT were replenished every 24 h (48 h culture: 24 + 24 h) without changing the culture medium. Graphs show: (A, C) the % of cells in each cycle phase detected in one representative experiment, (B, D) the % of cells in S phase cycle expressed as means ± SEM (n = 3). Each experiment was performed in triplicate. §§p < 0.01, significantly different from untreated cells; *p < 0.05, **p < 0.01, significantly different from treated cells at the same drug concentration.
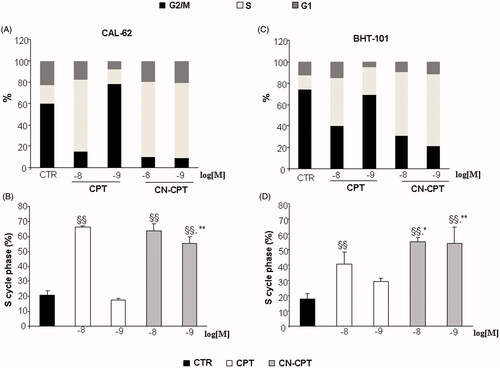
Figure 3. Proportions of Annexin-V-positive cells and levels of caspase-3 activity after CPT or CN-CPT treatment. Annexin-V-positive cells (A, B) and caspase-3 activity (C, D) was evaluated in CAL-62 (A, C) and BHT-101 (B, D) cells cultured for 48 h in the presence or absence of CPT or CN-CPT. CPT and CN-CPT were replenished every 24 h (48 h culture: 24 + 24 h) without changing the culture medium. Results are expressed as % of Annexin-V-positive cells and relative caspase activity %, calculated as result displayed by each treatment/the results displayed by untreated cells (n = 5). §p < 0.05; §§p < 0.01, significantly different from untreated cells; *p < 0.05; **p < 0.01, significantly different from treated cells at the same drug concentration.
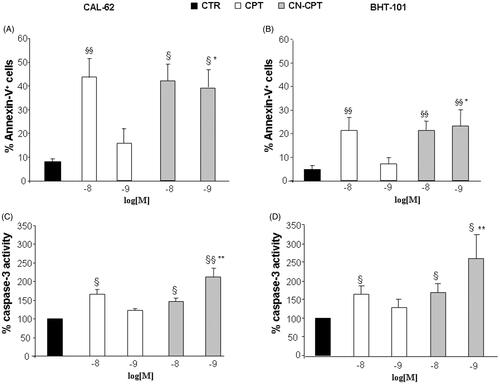
Figure 4. Effect of CPT and CN-CPT on cells adhesion and cell migration of CAL-62 and BHT-101 cell lines. (A,B) HUVEC were treated or not treated with CPT or CN-CPT for 24 h, washed and used in the adhesion assay with untreated CAL-62 (A) and BHT-101 (B) cells (1 × 10⁵/well). The data are presented as percentage of inhibition of the adhesion of treated cells compared to control (untreated cells). Each experiment was performed in triplicate. Data shown are means ± SEM (n = 5). *p < 0.05; **p < 0.01 significantly different from the same concentration of CPT. (C,D) In the Boyden chamber assay, CAL-62 (C) and BHT-101 (D) cells were plated onto the apical side of Matrigel-coated filters in the presence and absence of either CPT or CN-CPT, and FCS 20% was loaded in the basolateral chamber as a chemotactic stimulus. Data are expressed as mean ± SEM (n = 5) of the percentage of inhibition versus control migration **p < 0.01 significantly different from the same concentrations of CPT.
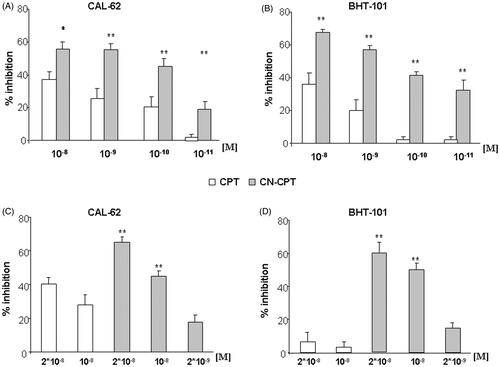
Figure 5. Effect of CPT and CN-CPT on β-PIX expression and Erk1,2 phosphorylation in CAL -62 (A), and BHT-101 (C). Cells were treated with CPT or CN-CPT (10−8 and 10−9 M) for 48 h. CPT and CN-CPT were replenished every 24 h (48 h culture: 24 + 24 h) without changing the culture medium. The same blots were probed with anti β-actin antibody as a control. (A, C): Western blot analysis from a representative experiment. (B, D): Densitometric analysis of β-PIX expression and Erk1,2 phosphorylation expressed in arbitrary units; data are expressed as means ± SEM (n = 3) and shown as % of the controls. §p < 0.05 significantly different from untreated cells; *p < 0.05 significantly different from treated cells at the same concentration.
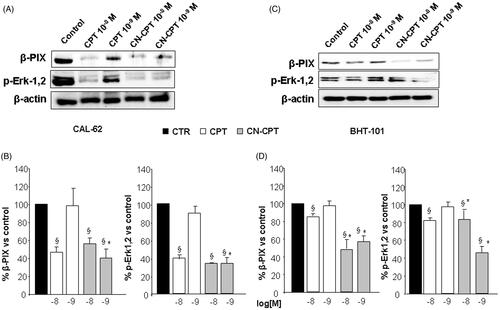
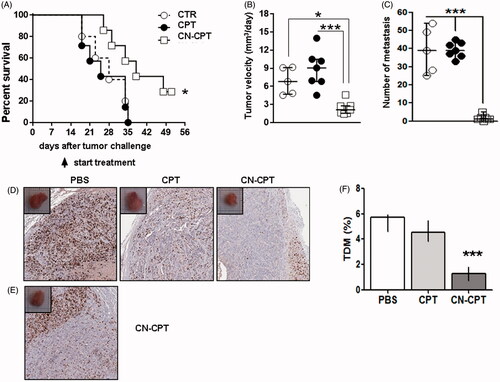
Figure 6. Treatment with CN-CPT delays the growth of orthotopic anaplastic thyroid carcinoma xenografts in vivo. CAL-62 cells (1 × 10⁶) were injected into the right thyroid lobe of NSG mice. Mice were injected with PBS (○, n = 5), CPT (•, n = 7) or CN-CPT (□, n = 7) at day 10 after tumor challenge. (A) Kaplan–Meier survival analysis of untreated and treated mice. *p < 0.05 compared to the PBS-treated group. Graphs show: (B) tumor velocity and (C) the number of metastasis in the lung for each group, expressed as median and interquartile range. *p < 0.05; ***p < 0.001 compared to the PBS-treated group and CPT-treated group. (D) Representative immunohystochemical staining for Ki-67 of tumor sections from mice treated with PBS, CPT or CN-CPT sacrificed at day 34 after tumor challenge. (E) Ki-67 staining of tumor section from a mouse treated with CN-CPT and sacrificed at day 51 after tumor challenge. (F) Graph shows the tumor microvessel density (TMD) determined as the percentage of CD31-positive area on the tumor sections. Three randomly selected areas from three tumors from each group were analyzed; data are expressed as median and interquartile ranges. ***p < 0.001 compared to the PBS-treated group and CPT-treated group.