Figures & data
Figure 1. Optimization of the transfection conditions. (a) Effects of the duration of US irradiation, (b) dose of BLs, and (c) injection volume. (a) Injection of a 600 μL mixture of pDNA and BLs (250 μg), followed by US irradiation of different durations. (b) Injection of a 600 μL mixture of pDNA and different doses of BL, followed by US irradiation for 3 min. (c) Injection of several volumes of the mixture (BLs; 250 μg), followed by US irradiation for 3 min. Six hours after injection of pCMV–Luciferase, the luciferase activity was measured. Each bar represents the mean ± SE of four experiments. *p < 0.05.
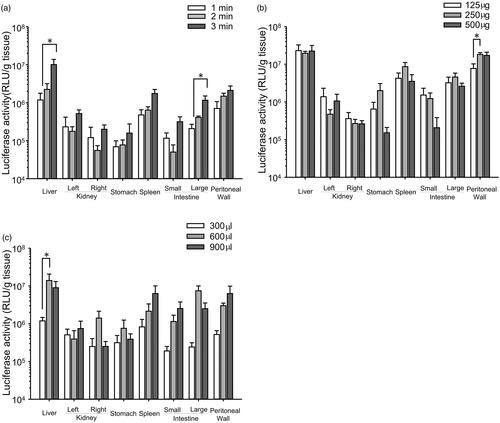
Figure 2. Effect of the area of US irradiation on transgene expression in each tissue. Mice were injected intraperitoneally with a 600 μL mixture of pDNA (60 μg) and BLs (250 μg), followed by US irradiation for 3 min to the liver. Six hours after injection of pCMV–Luciferase, the luciferase activity was measured. Each bar represents the mean ± SE of four experiments.
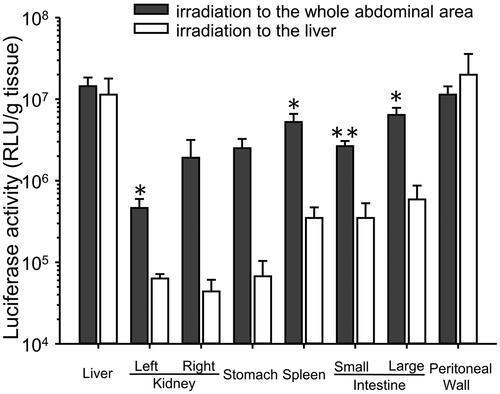
Figure 3. Duration of transgene expression after transfection. The time course was analyzed using pCpGfree–Lucia (a) and pCMV–luciferase (b). Each value represents the mean ± SE of at least four experiments. *p < 0.05 compared with serum.
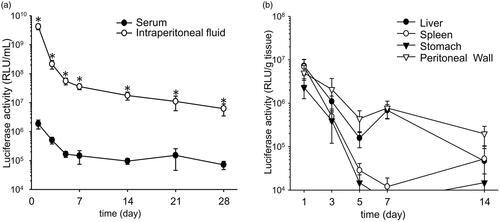
Figure 4. Assesment of peritoneal toxicity after transfection with BLs and US irradiation. Histological assessment with H&E staining of the peritoneal wall (a). Scale bar, 100 μm. Evaluation of peritoneal function by dual macromolecular markers (b). Each bar represents the mean ± SE of four experiments. There were no significant differences.
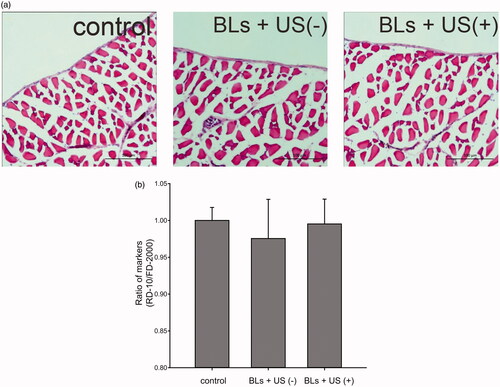
Figure 5. Assessment of hepatic toxicity. Serum ALT activities in the control group, BLs without US irradiation group, and BLs with US irradiation group were determined. Each value represents the mean ± SE of four experiments. The differences were not significant.
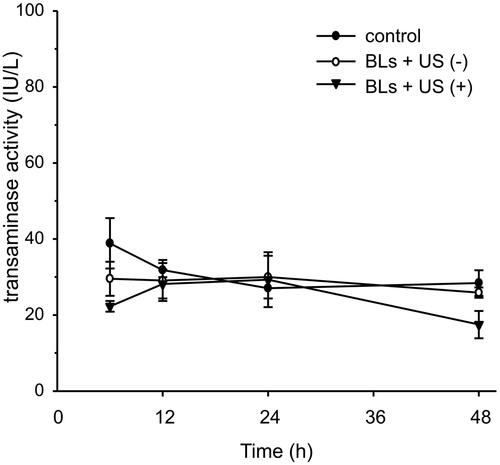
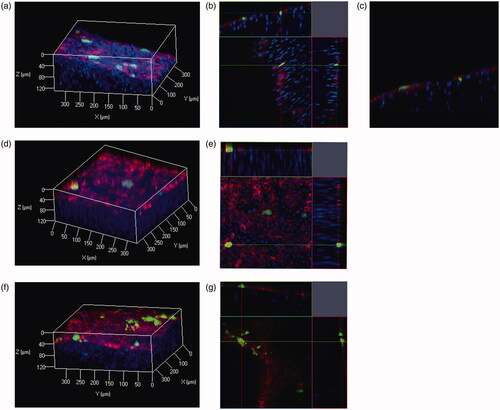
Figure 6. Spatial distributions of transgene expression in peritoneal tissues after pZsGreen1-N1 injection with BLs and US irradiation. Blue signals indicate nuclei, green signals indicate expression of the ZsGreen1 transgene, and red signals indicate DiI-labeled surface cells of the peritoneum. Transgene expression in the peritoneal wall is indicated in (a) three-dimensional (3 D), (b) orthogonal, (c) X–Z plane images. Transgene expression in the liver and stomach is indicated as 3 D (d,f) and orthogonal (e.g.) images (Color version of this figure is available Online).