Figures & data
Figure 1. CEQ-loaded microspheres observed by scanning electron microscopy.
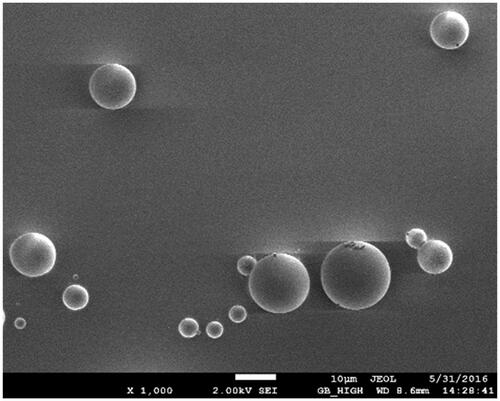
Figure 2. Cumulative CEQ release from CEQ-PLGA-MS in PBS (pH 7.4). In vitro release kinetics were obtained at 37 ± 1 °C by dialysis. CEQ release from stock solution was used as control. CEQ loading was 18.3 ± 1.3%. Data as mean ± SD, n = 3.
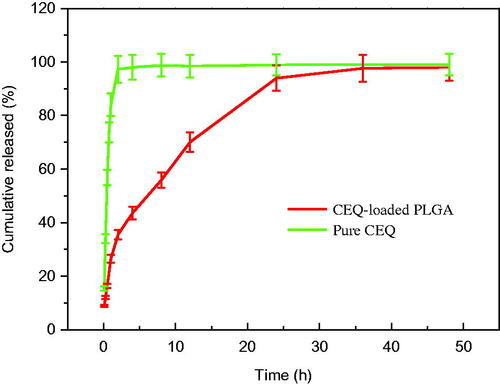
Table 1. The kinetic models simulated for the release behavior of CEQ-loaded PLGA microspheres.
Figure 3. Distribution of CEQ in mouse tissues following i.v. administration of a single dose (6 mg/kg) of CEQ. Each point represents the mean ± SD from six mice.
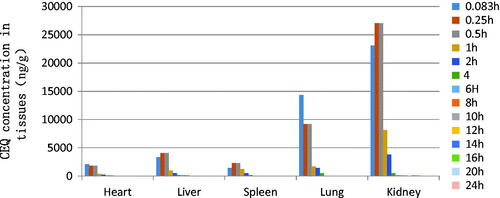
Figure 4. CEQ distribution in mouse tissues following i.v. administration of a single 6 mg/kg dose of CEQ-loaded microspheres. Each point represents the mean ± SD from six mice.
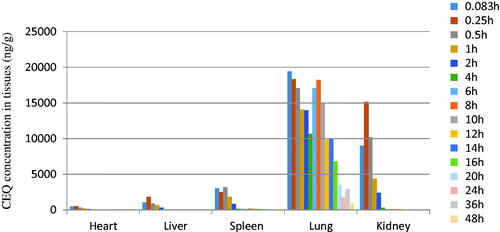
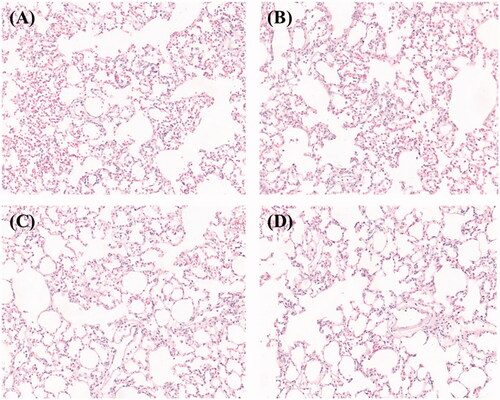
Figure 5. H&E staining of lung tissues i.v. administration of (A,C) CEQ-loaded microspheres or (B,D) microspheres only after (A,B) 12 h and (C,D) 48 h.