Figures & data
Figure 1. Intracellular drug accumulation of PTX and PTX-CPPs. (A) Cells were incubated with different concentrations of PTX and PTX-CPPs for 2 h. (B) Cells were incubated with 20 μM PTX and PTX-CPPs for different times. **p < 0.01.
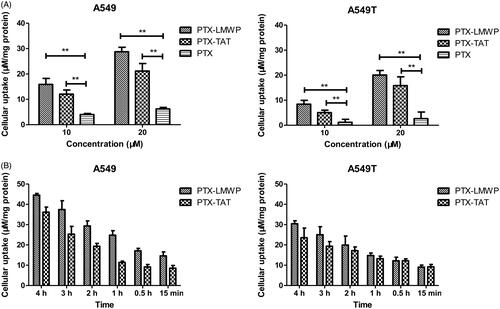
Figure 2. Viability of A549 and A549T cells treated with different concentrations of PTX and PTX-CPPs. (A) Cell viability. (B) IC50. **p < 0.01.
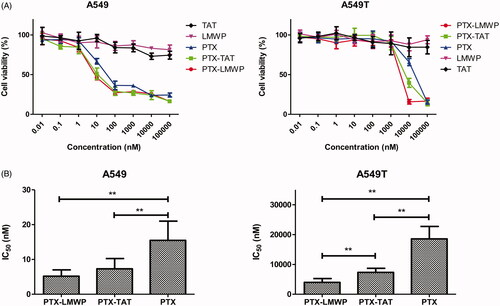
Figure 3. Cell apoptosis after incubating with 10 μM PTX or PTX-CPPs for 48 h. (A) Apoptosis of A549 cells. (B) Apoptosis of A549T cells. (C) Quantification of apoptosis data. *p < 0.05; **p < 0.01.
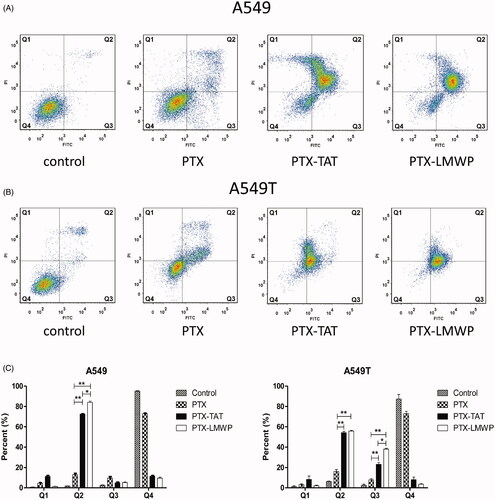
Figure 4. JC-1 forms and Δψm values of A549 and A549T cells. All cells were exposed to drugs at 10 μM for 48 h. (A) The distribution of different JC-1 forms in A549 cells. (B) The distribution of different JC-1 forms in A549T cells. (C) Ratio of red to green fluorescence in A549 and A549T cells. *p < 0.05; **p < 0.01.
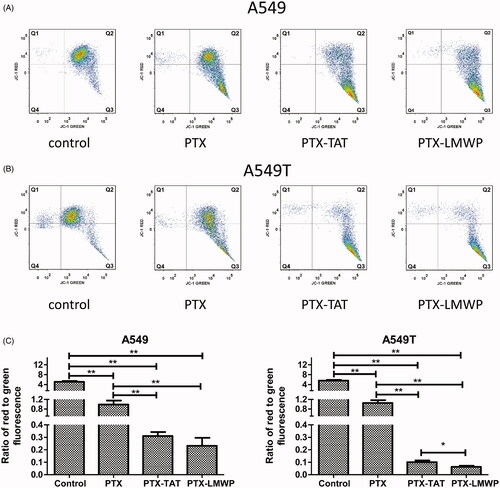
Figure 5. Cell-cycle profiles of A549 and A549T cells treated with 5 μM PTX or PTX-CPPs. (A) Cell-cycle distribution of A549 cells. (B) Cell-cycle distribution of A549T cells. (C) Quantification of cell cycle data. *p < 0.05; **p < 0.01.
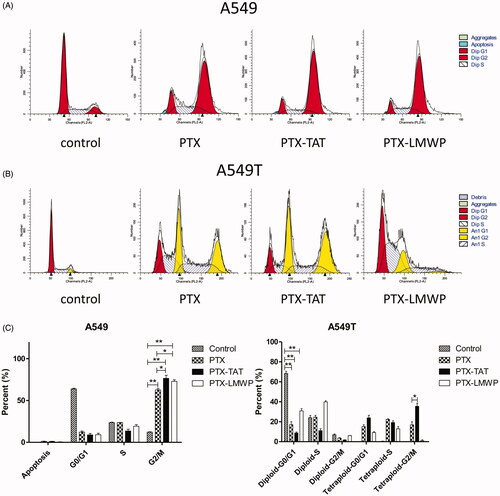
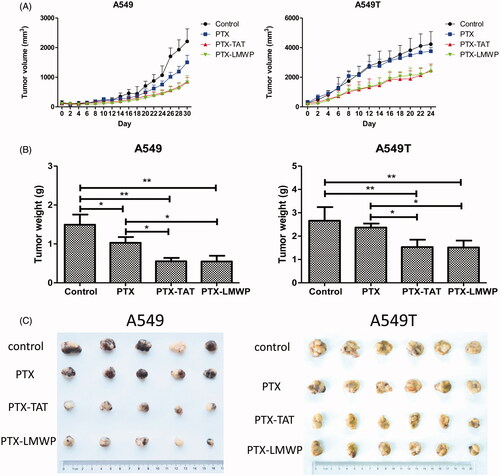
Figure 6. Anticancer efficacy of the drugs on tumor cell xenografts in female nude mice. (A) Tumor volume profiles. (B) Weights of tumors from mice after 24 or 30 d. (C) Photos of tumors separated from mice. *p < 0.05; **p < 0.01.
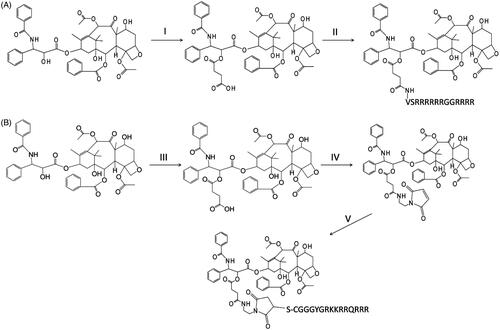
Scheme 1. Reaction schemes for the syntheses of PTX-CPPs. (A) The synthesis of PTX-LMWP. (B) The synthesis of PTX-TAT. (I) Succinic acid, DIPEA, DCM, RT, 12 h. (II) EDC, NHS, DIPEA, LMWP, RT, DMSO, 24 h. (III) Succinic anhydride, DIPEA, DCM, RT, 12 h. (IV) EDC, NHS, DIPEA, N-(2-aminoethyl) maleimide, DMSO, RT, 12 h. (V) TAT, DMSO, RT, 1 h.