Figures & data
Table 1. Particle size and encapsulation efficiency of PEG–lipid–PLGA NPs/BBR–SPC at different weight ratios of the BBR–SPC complex to PLGA polymer.
Figure 1. Schematic illustration of the preparation of PEG–lipid–PLGA NPs/BBR–SPC for oral drug delivery.
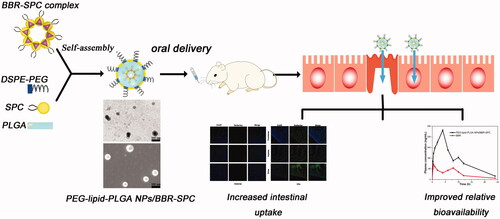
Figure 2. Characterization of PEG–lipid–PLGA NPs/BBR–SPC. (A) Schematic structure, (B) TEM image, (C) SEM image, (D) particle size distribution and (E) zeta potential of PEG–lipid–PLGA NPs/BBR–SPC.
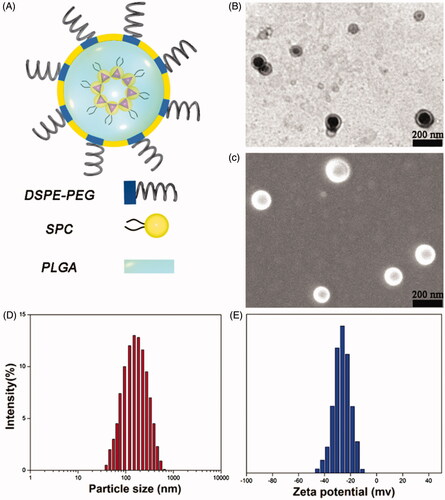
Table 2. Stability studies of PEG–lipid–PLGA NPs/BBR–SPC at SGF and SIF.
Figure 3. DSC and XRD of the PEG–lipid–PLGA NPs/BBR-SPC. (A) DSC and (B) XRD of BBR, SPC, BBR + SPC, BBR–SPC, PEG–lipid–PLGA NPs, a physical mixture of all ingredients and PEG–lipid–PLGA NPs/BBR–SPC.
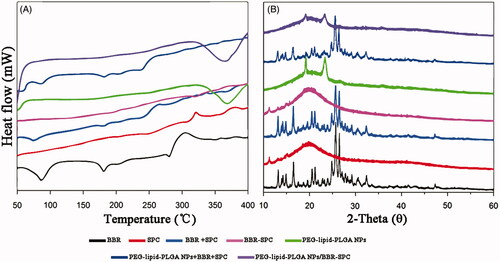
Figure 4. In vitro time-dependent drug release profiles of BBR and PEG–lipid–PLGA NPs/BBR–SPC in (A) SGF and (B) SIF.
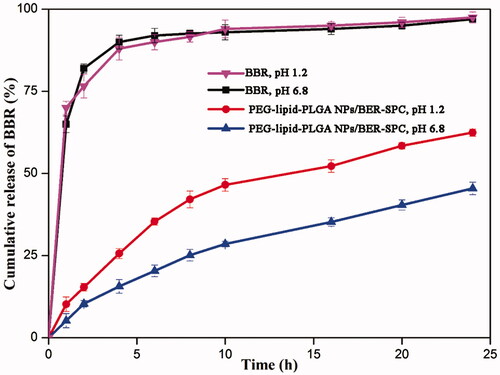
Figure 5. CLSM images of different segments of the small intestine. CLSM images showing the absorption of (A) BBR and (B) PEG–lipid–PLGA NPs/BBR–SPC in different segments of the small intestine. DAPI was used to label the cell nuclei (blue).
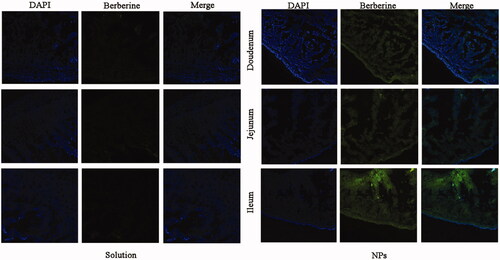
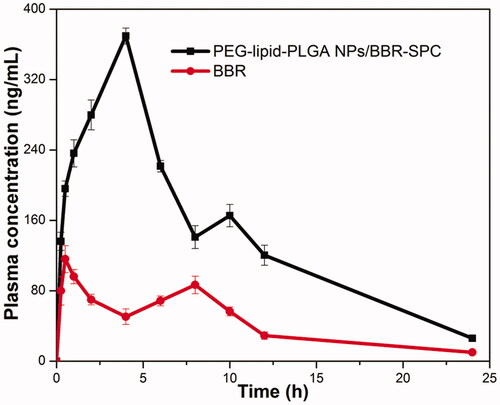
Figure 6. The profiles of the plasma BBR level versus time among the rats after oral administration of BBR and PEG–lipid–PLGA NPs/BBR–SPC. The data are presented as the mean ± SD (n = 6).