Figures & data
Table 1. Drug content of etoposide in different stressed conditions.
Figure 1. Macroscopic picture of the entire etoposide-loaded implants.
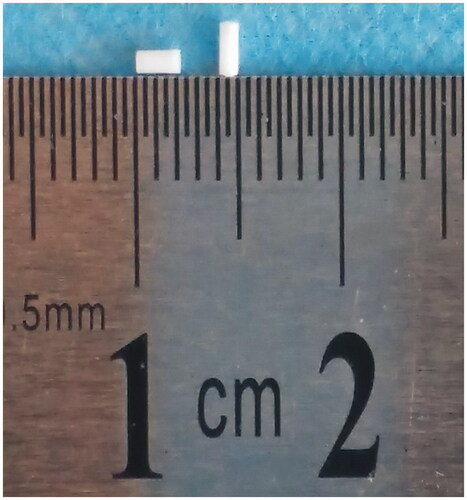
Figure 2. SEM picture of the etoposide-loaded implants. (A). External surface of the implant (magnification ×600). (B) External surface of the implant (magnification ×3000). (C). Cross-section of the implant (magnification ×600). (D). Cross-section of the implant (magnification ×3000).
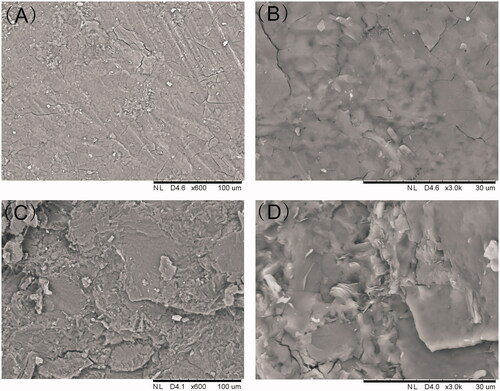
Figure 3. The release profiles of etoposide-loaded implants. (A) The in vitro cumulative release profiles of etoposide from the implants. Data are shown as mean ± standard deviation (n = 6 for each time). (B) The in vivo cumulative release profiles of etoposide from the implants. Data are shown as mean ± standard deviation (n = 6 for each time).
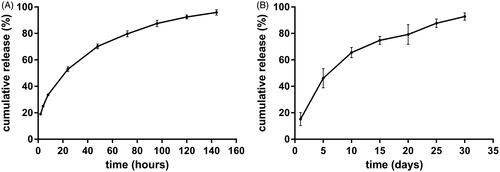
Figure 4. Antitumor efficacy of etoposide-loaded implants on A549 xenograft mouse model. (A) Tumor growth curve of the tumor-bearing mice after intraperitoneal administration of etoposide solution or implantation of different doses of etoposide-loaded implants. (B) The average body weight of mice during the treatment period. (C) Picture of the mice bearing A549 tumor on day 23 post implantation. (D) Picture of tumors dissected from mice on day 23 post-implantation. (E). The average tumor weight of each group (P value less than 0.05 was marked as *).
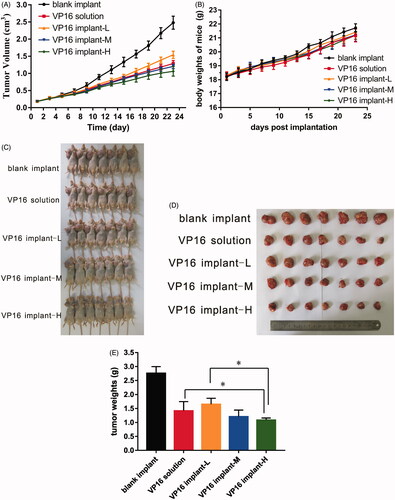
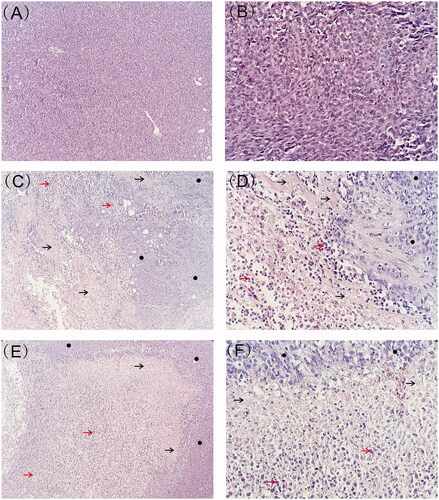
Figure 5. Typical histology images of tumors retrieved on day 7 and day 23 post-implantation (black arrow represents necrotic area, red arrow represents nuclear debris of tumor cells and black circle represents viable tumor cells). (A) Histology image of tumor treated with blank implants (magnification ×100). (B) Histology image of tumor treated with blank implants (magnification ×400). (C) Histology image of tumor treated with high-dose etoposide-loaded implants (drug content 3 mg) on day 7 post implantation (magnification ×100). (D) Histology image of tumor treated with high-dose etoposide-loaded implants (drug content 3 mg) on day 7 post implantation (magnification ×400). (E) Histology image of tumor treated with high-dose etoposide-loaded implants (drug content 3 mg) on day 23 post-implantation (magnification ×100). (F) Histology image of tumor treated with high-dose etoposide-loaded implants (drug content 3 mg) on day 23 post-implantation (magnification ×400).