Figures & data
Figure 1. In vitro release profiles of DNR from different niosomal formulations in PBS (pH 7.4) at 37 °C. Data represent mean ± SD (n = 3).
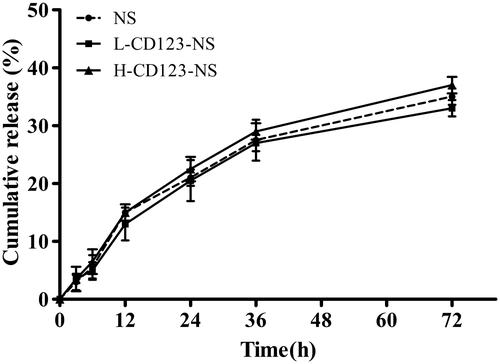
Figure 2. Quantification of the total and surface expression levels of CD123 in NB4 and THP-1 cells, respectively. Numbers indicate percentages of positive cells. IgG2a was set as an isotype control of anti-CD123 antibody.
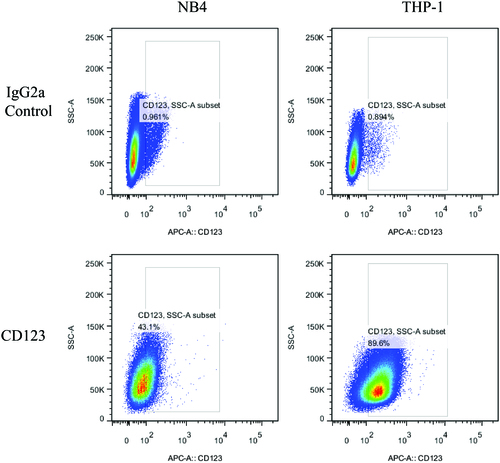
Figure 3. Quantitative determination of the cellular uptake of each Coumarin-6-loaded NS group by NB4 and THP-1 cells in vitro. (A) The uptake of L-CD123-NS (final Coumarin-6 concentration of each sample was 40 ng/ml) in NB4 and THP-1 cells. (B) The uptake of H-CD123-NS (final Coumarin-6 concentration of each sample was 10 ng/ml) in NB4 and THP-1 cells. (C) Summary of L-CD123-NS cellular association in NB4 and THP-1 cells. (D) Summary of H-CD123-NS cellular association in NB4 and THP-1 cells. ∗∗∗Indicate p < .001 versus the CD123-NS group, each bar represents mean ± SD (n = 3). CD123 + and IgG2a + mean the prior presence of free anti-CD123 antibody or IgG2a isotype control antibody for competition experiments.
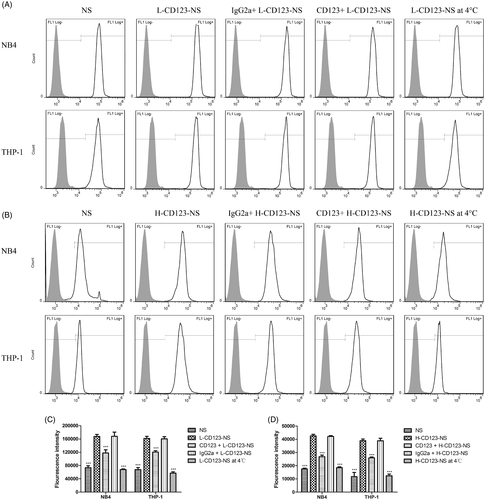
Figure 4. Cellular distribution of Coumarin-6-loaded NS, L-CD123-NS, IgG2a + L-CD123-NS and CD123 + L-CD123-NS in (A) NB4 and (B) THP-1 cells at 37 °C. CD123 + and IgG2a + mean the prior presence of free anti-CD123 antibody or IgG2a isotype control antibody for competition experiments.
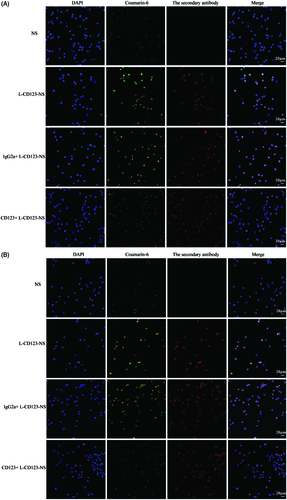
Table 1. IC50 of different treatment groups to DNR in NB4 and THP-1 cells.
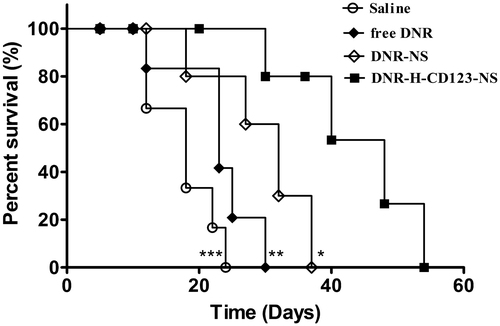
Figure 5. Therapeutic activity of DNR-H-CD123- NS in THP-1 bearing NOD/SCID mice (n = 8). Animals treated intravenously with DNR-H-CD123- NS (3 mg/kg DNR) survived significantly longer than mice treated with saline, free DNR and DNR-NS. ***p < .001, **p < .01 and *p < .05 versus the DNR-H-CD123- NS group, respectively (long-rank test).